Fig. 13
Download original image
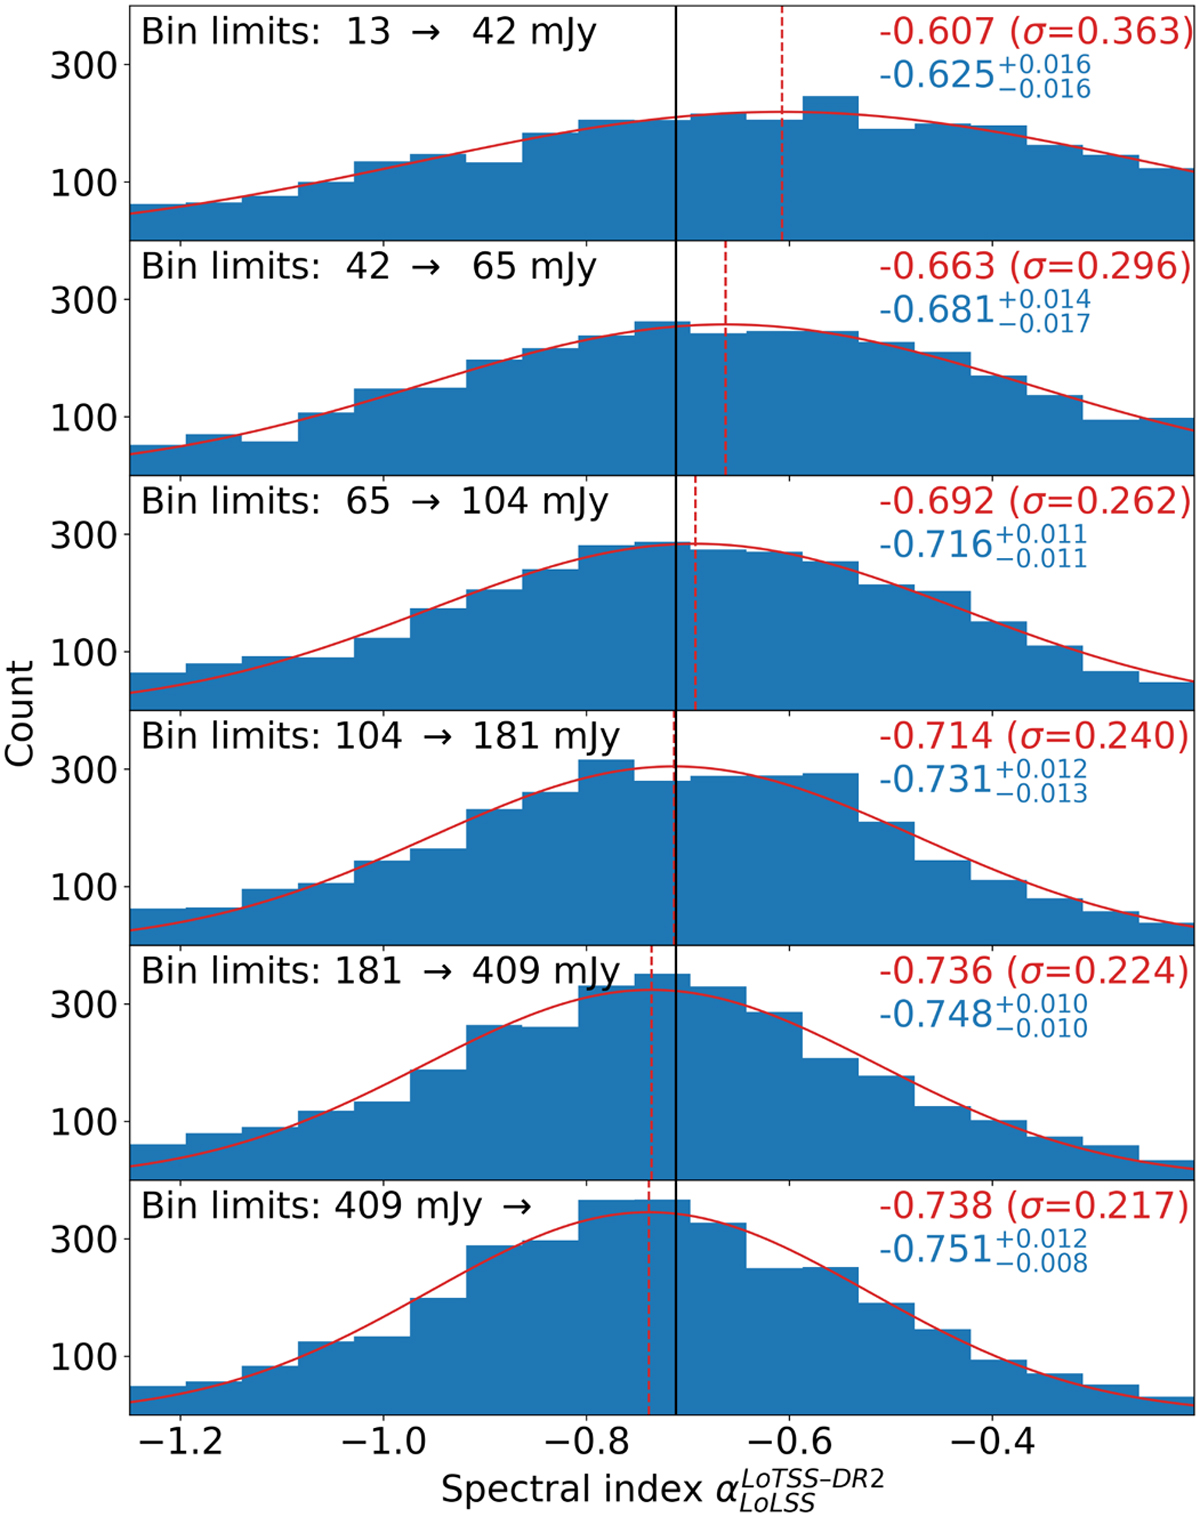
Spectral index ![]() distribution in six equally-numbered flux density bins at 54 MHz. In each bin, a Gaussian fit and its centre is marked and the fit details (mean and standard deviation) are in red in the top right corner. Below that, in blue, is the median, along with the 95% confidence interval ranges. In each top-left corner, the flux density limits of the bin are noted, while the black line indicates the overall mean as previously found in Fig. 10.
distribution in six equally-numbered flux density bins at 54 MHz. In each bin, a Gaussian fit and its centre is marked and the fit details (mean and standard deviation) are in red in the top right corner. Below that, in blue, is the median, along with the 95% confidence interval ranges. In each top-left corner, the flux density limits of the bin are noted, while the black line indicates the overall mean as previously found in Fig. 10.
Current usage metrics show cumulative count of Article Views (full-text article views including HTML views, PDF and ePub downloads, according to the available data) and Abstracts Views on Vision4Press platform.
Data correspond to usage on the plateform after 2015. The current usage metrics is available 48-96 hours after online publication and is updated daily on week days.
Initial download of the metrics may take a while.