Fig. 12
Download original image
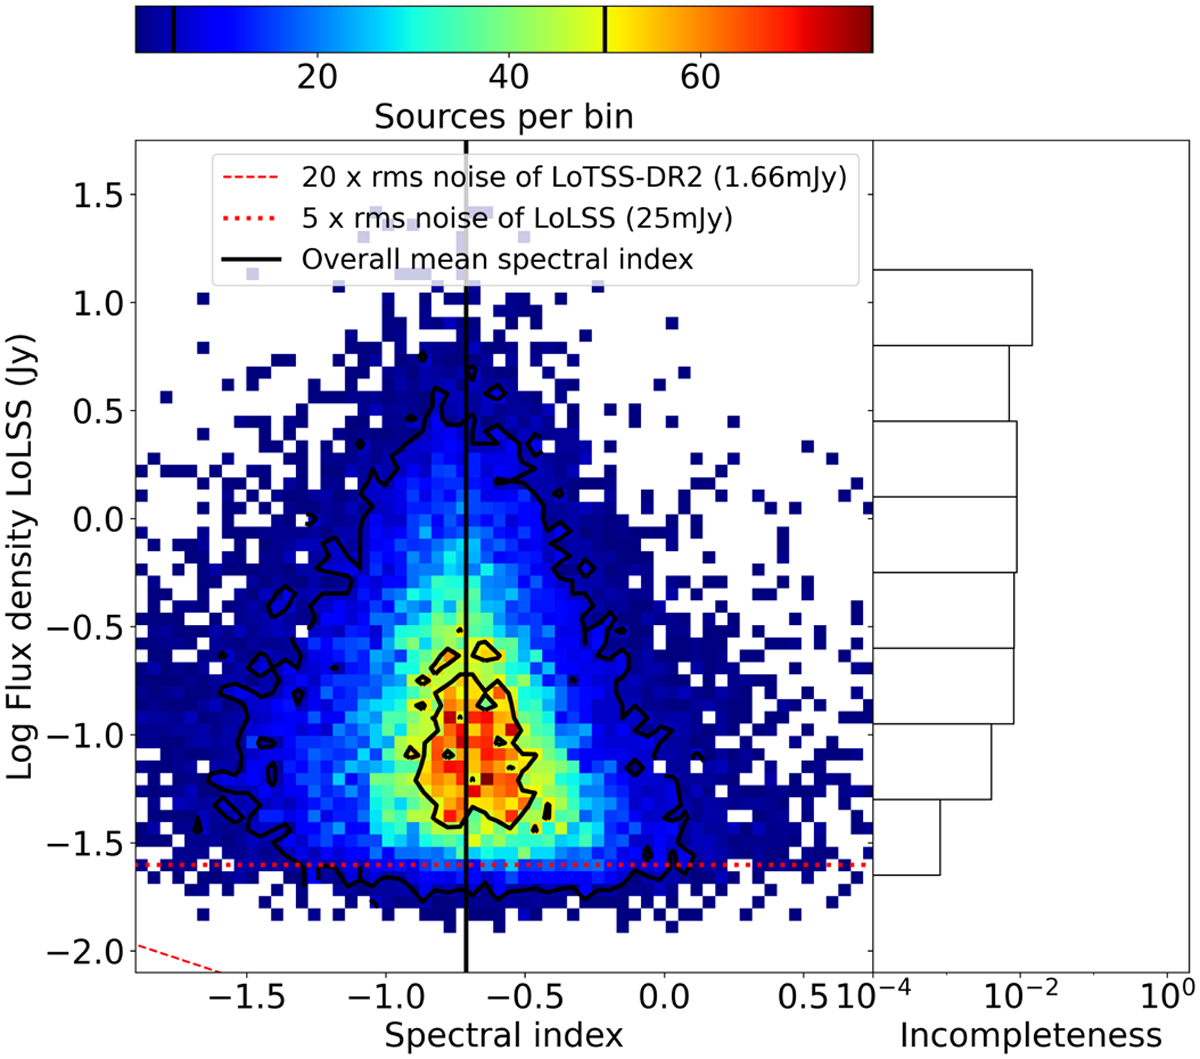
Spectral index and flux density 2D histogram. Right plot gives the incompleteness as the ratio of unmatched to all sources in a given flux density bin. The red dashed lines indicate the flux density limits of the surveys, while the black vertical line indicates the average spectral index. The black lines in the color bar define the contours.
Current usage metrics show cumulative count of Article Views (full-text article views including HTML views, PDF and ePub downloads, according to the available data) and Abstracts Views on Vision4Press platform.
Data correspond to usage on the plateform after 2015. The current usage metrics is available 48-96 hours after online publication and is updated daily on week days.
Initial download of the metrics may take a while.