Open Access
Fig. 11
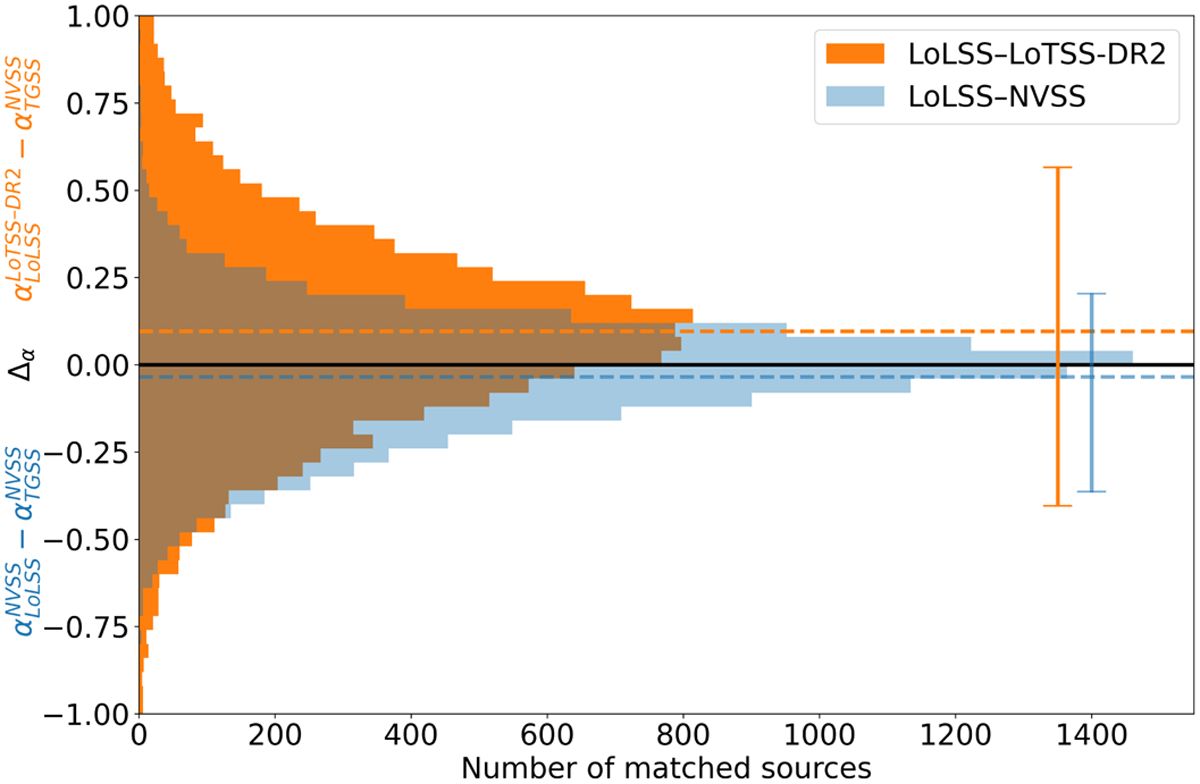
Download original image
Spectral index difference between two spectral indices calculated in this study (LoLSS–LoTSS-DR2 and LoLSS–NVSS) and the TGSS–NVSS spectral index catalogue of de Gasperin et al. (2018). The dashed lines indicate the mean value and the bars on the right depict the 90 per cent interval of Δα.
Current usage metrics show cumulative count of Article Views (full-text article views including HTML views, PDF and ePub downloads, according to the available data) and Abstracts Views on Vision4Press platform.
Data correspond to usage on the plateform after 2015. The current usage metrics is available 48-96 hours after online publication and is updated daily on week days.
Initial download of the metrics may take a while.