Open Access
Fig. 2
Download original image
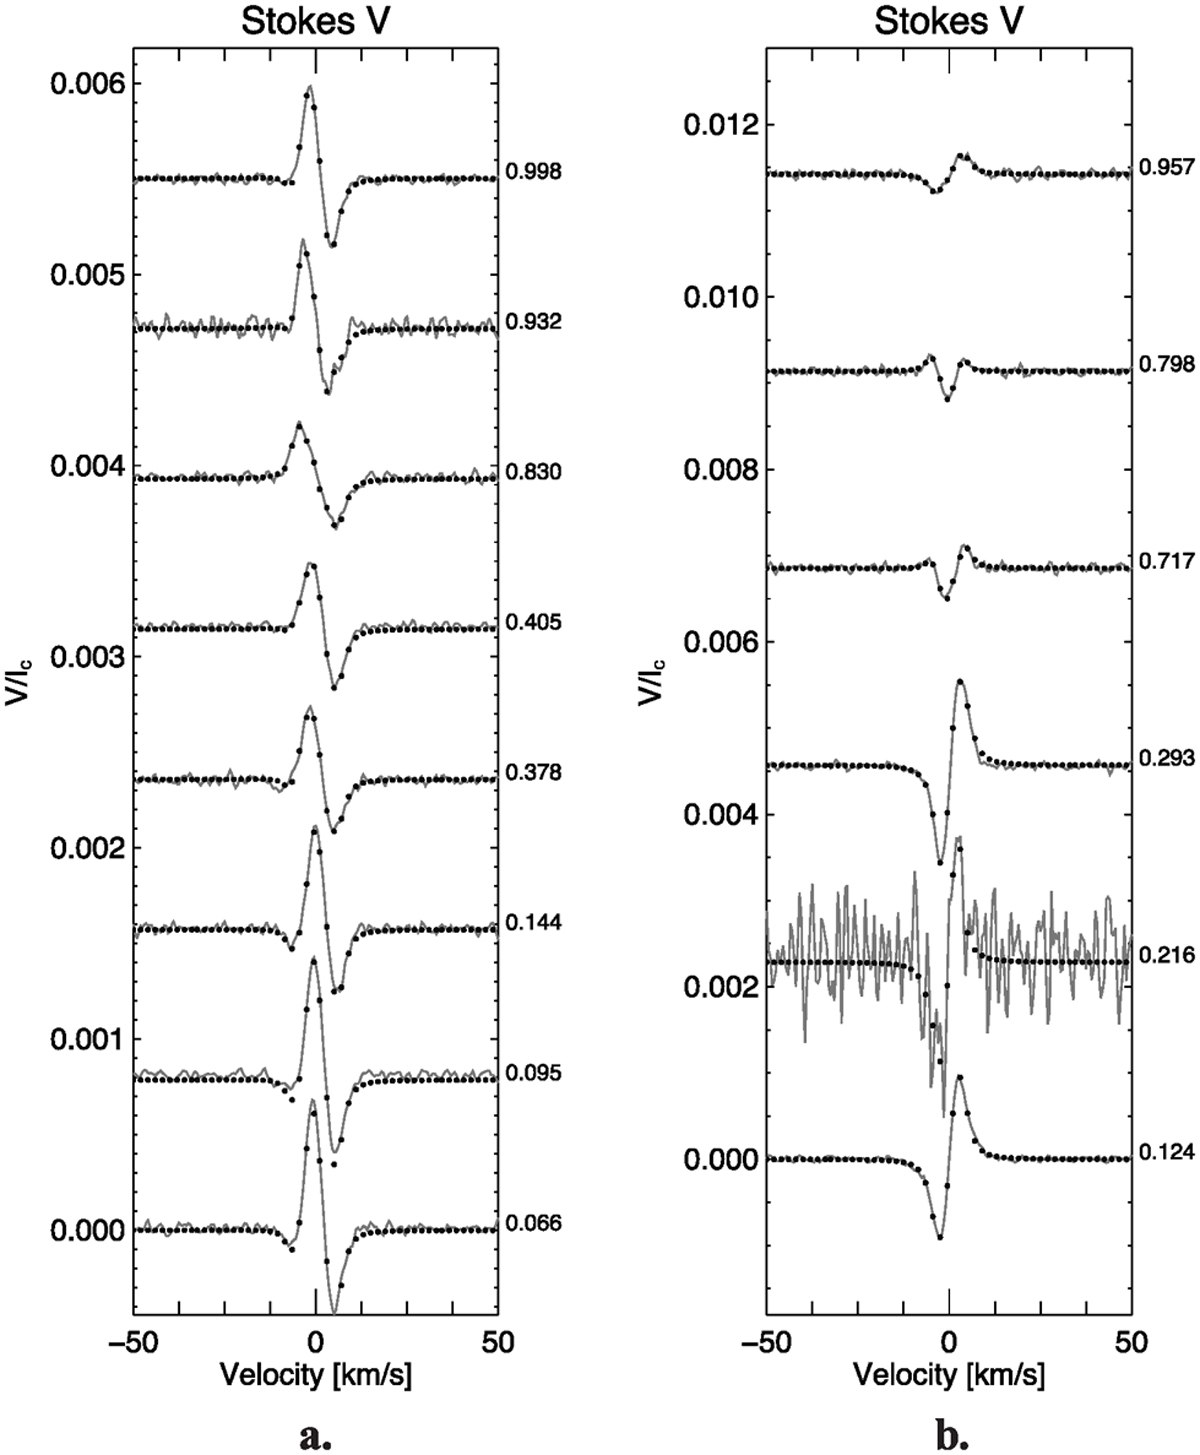
Observed (lines) and inverted (dots) SVD Stokes-V line profiles. Panel a: ξ Boo A. Panel b: ξ Boo B. Profiles are shifted in intensity arbitrarily and labeled with their respective phases ϕ on the right side of each panel. Rotation advances from bottom to top.
Current usage metrics show cumulative count of Article Views (full-text article views including HTML views, PDF and ePub downloads, according to the available data) and Abstracts Views on Vision4Press platform.
Data correspond to usage on the plateform after 2015. The current usage metrics is available 48-96 hours after online publication and is updated daily on week days.
Initial download of the metrics may take a while.