Fig. 1
Download original image
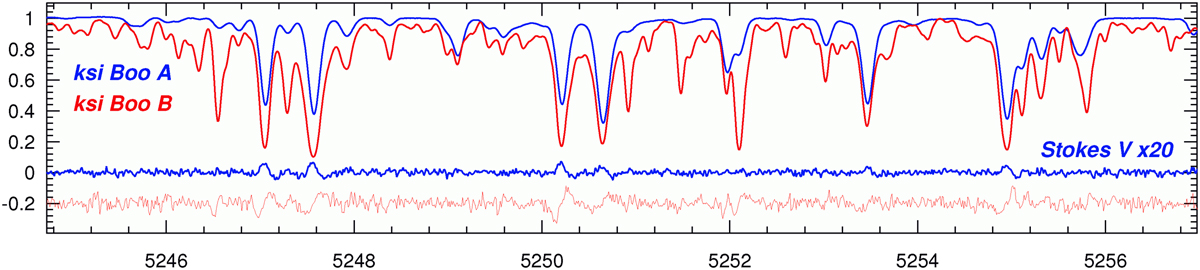
Stokes IV example spectra for a wavelength range of 10 Å near 5250 Å. The vertical axis is relative intensity, and the horizontal axis is wavelength in Angstroms. Top: Stokes-I spectra of ξ Boo A (blue) and ξ Boo B (red). Bottom: Stokes-V spectra of ξ Boo A (blue) and ξ Boo B (red), the latter offset by −0.2 in intensity for better visualization, and both enhanced in scale by a factor 20 compared to Stokes I.
Current usage metrics show cumulative count of Article Views (full-text article views including HTML views, PDF and ePub downloads, according to the available data) and Abstracts Views on Vision4Press platform.
Data correspond to usage on the plateform after 2015. The current usage metrics is available 48-96 hours after online publication and is updated daily on week days.
Initial download of the metrics may take a while.