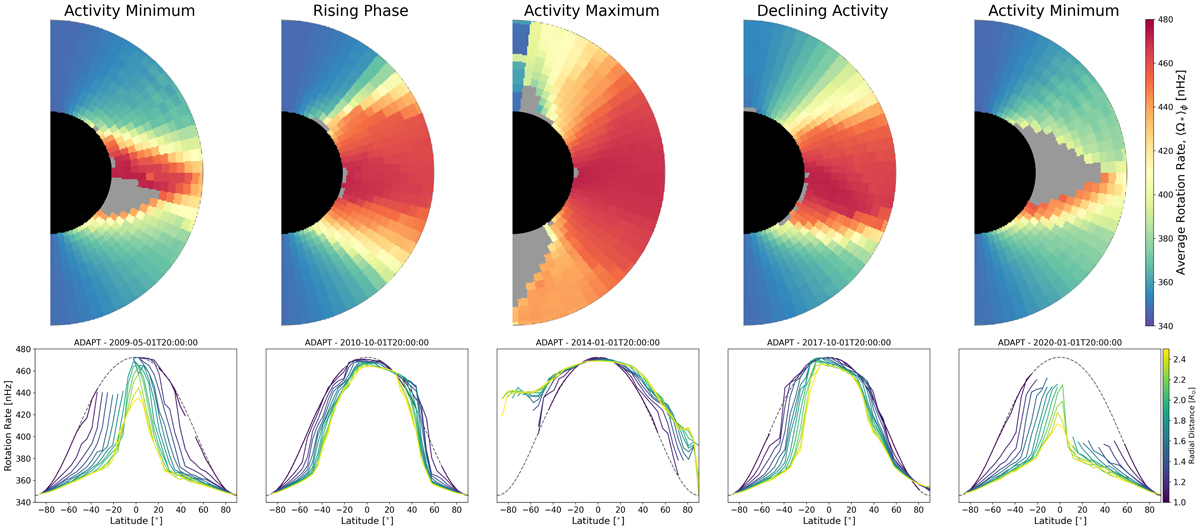
Fig. 7.
Download original image
Azimuthally averaged rotation rates from the PFSS models shown in Fig. 3. Averaging is peformed on the open field regions, grey regions indicate closed field at all longitudes (hence no value returned). The limited number of open magnetic field lines over the north pole during the ‘Activity Maximum’ model, lead to some oddity in the north-most latitude bin that should be disregarded. The lower panels show the latitudinal profiles coloured by radial distance from the surface (yellow being the furthest). The rising and declining phases show a clear north-south asymmetry which is also observed in the systematic differences in ⟨θ⟩ between the two hemispheres in Fig. 4.
Current usage metrics show cumulative count of Article Views (full-text article views including HTML views, PDF and ePub downloads, according to the available data) and Abstracts Views on Vision4Press platform.
Data correspond to usage on the plateform after 2015. The current usage metrics is available 48-96 hours after online publication and is updated daily on week days.
Initial download of the metrics may take a while.