Fig. 5.
Download original image
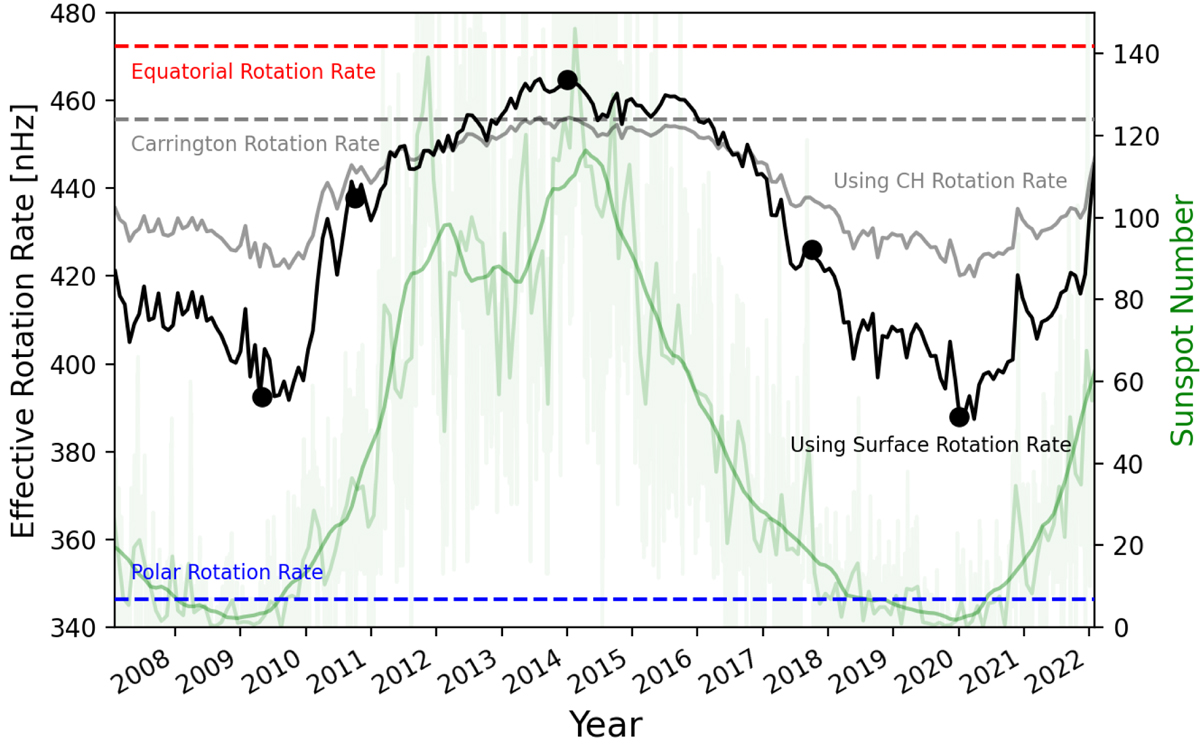
Effective rotation rate versus solar cycle, calculated with Eq. (14). Solid black line represents the ADAPT-GONG magnetograms using Rss = 2.5 R⊙, and the observed surface rotation rate. Dashed lines indicate the equatorial, polar and Carrington rotation rate. The solid grey line instead uses the less-extreme coronal hole rotation profile (see Appendix A). PFSS models shown in Fig. 3 are highlighted with black circles. The daily, monthly, and monthly smoothed sunspot number from the Sunspot Index and Long-term Solar Observations (SILSO) are displayed in the background of the figure with a solid green lines of varying opacity.
Current usage metrics show cumulative count of Article Views (full-text article views including HTML views, PDF and ePub downloads, according to the available data) and Abstracts Views on Vision4Press platform.
Data correspond to usage on the plateform after 2015. The current usage metrics is available 48-96 hours after online publication and is updated daily on week days.
Initial download of the metrics may take a while.