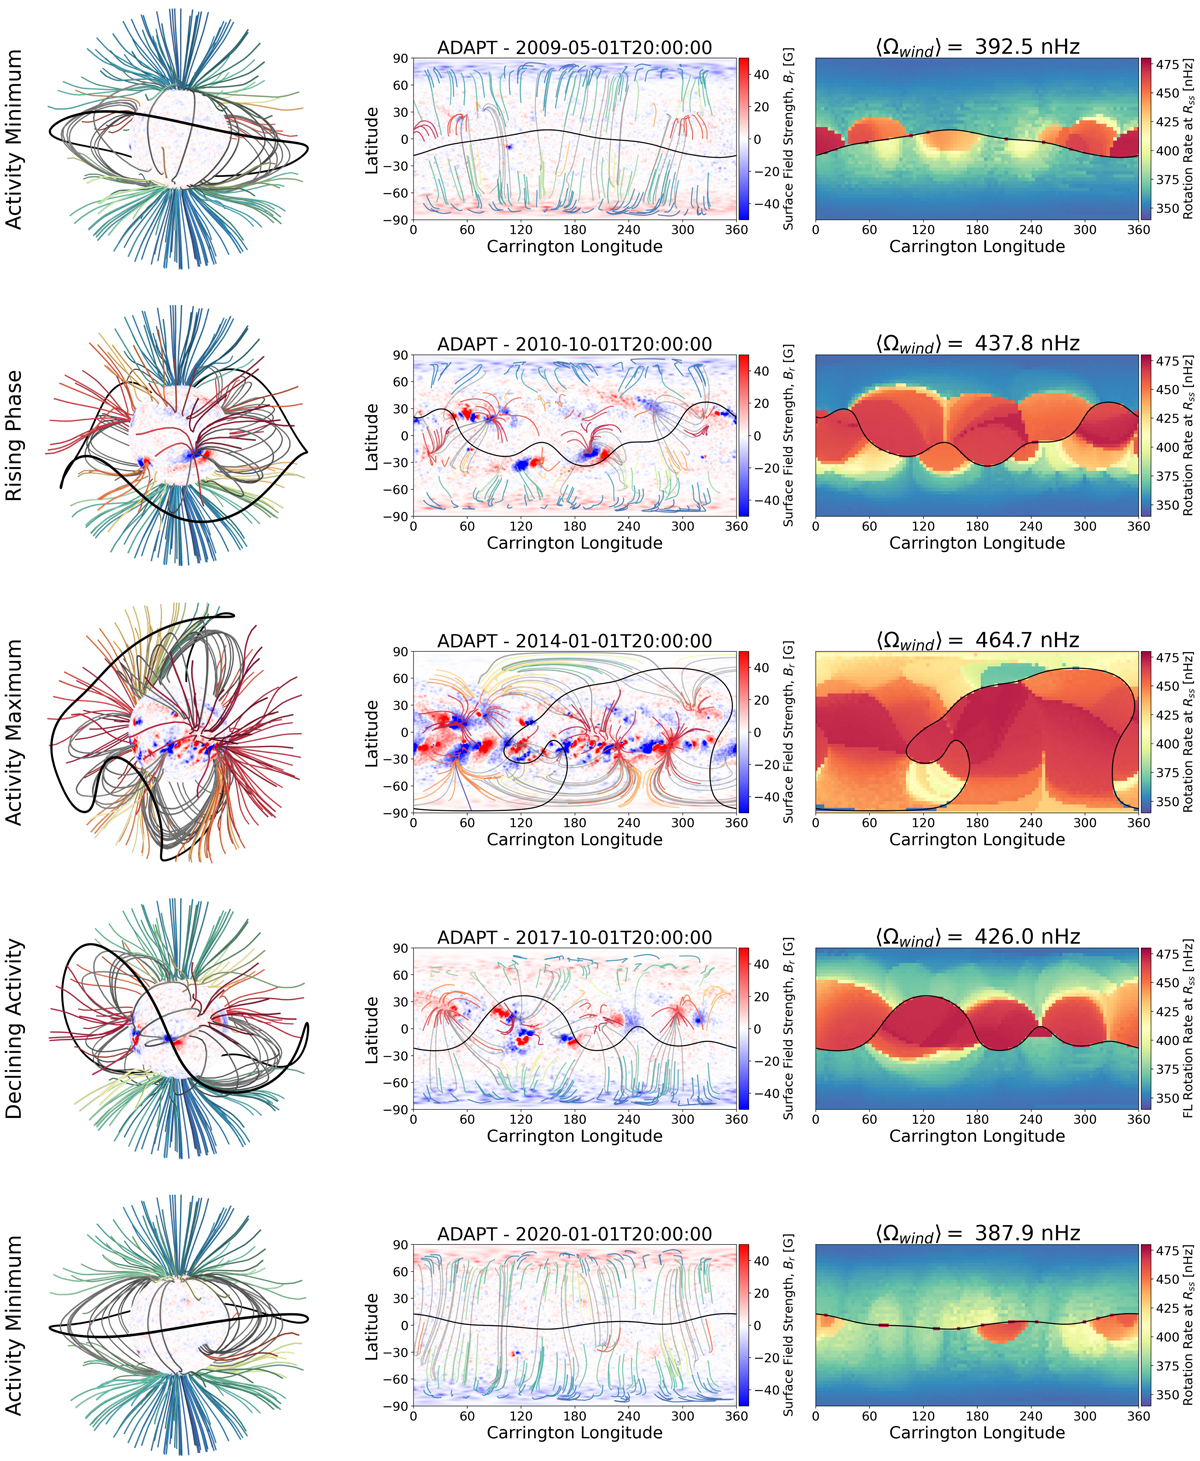
Fig. 3.
Download original image
Summary of five models from different phases of solar cycle 24. The first column shows 3D renderings of the PFSS models, with open magnetic field lines coloured by surface rotation rate (see Fig. 1). Closed magnetic field lines are shown in grey. The solar surface is coloured with red and blue representing the radial magnetic field used in each PFSS model, and the location of the Heliospheric Current Sheet (HCS) is indicated in black at the source surface. The middle column displays the same information projected on a latitude-longitude grid. The final column shows the effective rotation rate of field lines at the source surface (Rss = 2.5 R⊙). These values are acquired by tracing field lines down to the surface, and returning the value of the surface rotation rate (this is the same as for the colour on the field line renderings). The mean value of the effective rotation rate ⟨Ωwind⟩ is listed with each model (the Carrington rate is ∼456 nHz).
Current usage metrics show cumulative count of Article Views (full-text article views including HTML views, PDF and ePub downloads, according to the available data) and Abstracts Views on Vision4Press platform.
Data correspond to usage on the plateform after 2015. The current usage metrics is available 48-96 hours after online publication and is updated daily on week days.
Initial download of the metrics may take a while.