Fig. A.1.

Download original image
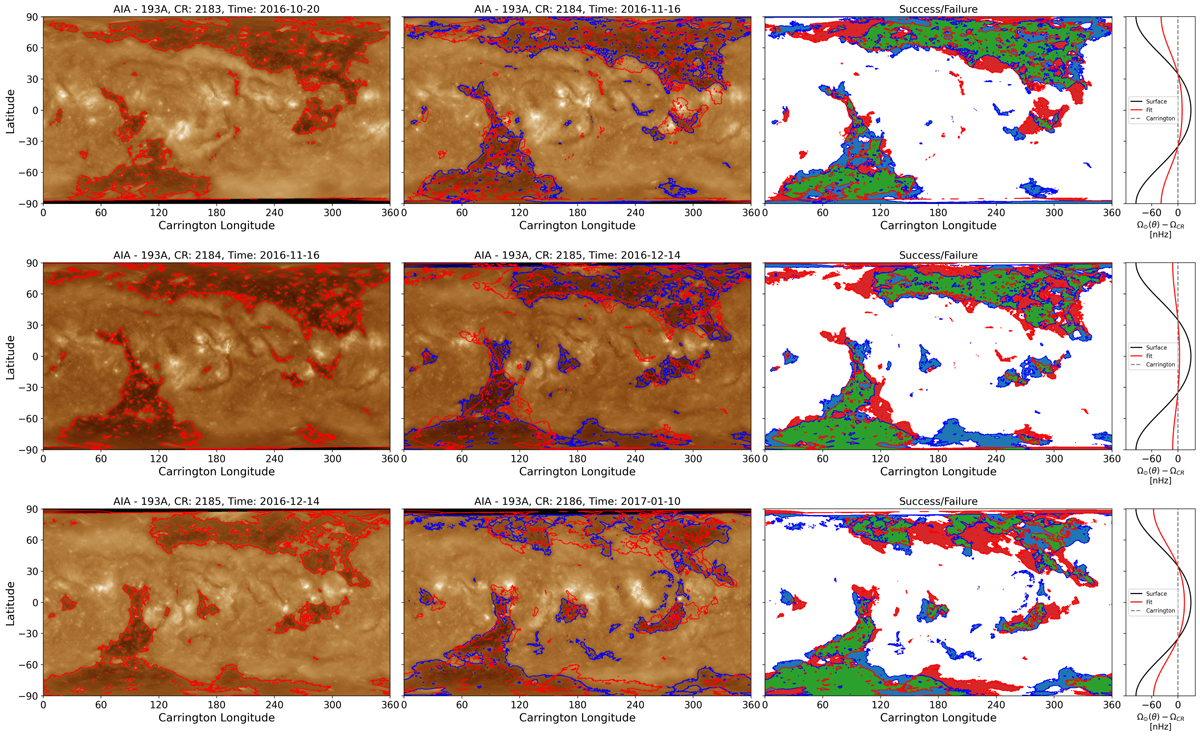
Fitting the differential rotation profile of the coronal holes in SDO/AIA-193A images during CR2183-CR2186. Each row repeats the following sequence. The left column depicts a given synoptic EUV chart in the sequence CR2183 - CR2185 with a red contour identifying the coronal hole area using a brightness threshold. The second column shows the next synoptic chart (CR2184 - CR2186) with a blue contour identifying the coronal hole area in the same manner as the leftmost column. The area inside these contours is assumed to be representative of the coronal hole area for each synoptic chart. The red contour from the first column is then distorted using equation (A.2) by varying the Ωeq, α2, and α4 parameters, in order to find a maximum overlap of the area between the two contours. The ‘best fit’ distorted contour is over-plotted in the second column in red. The third column depicts the quality of the overlap between the red distorted coronal hole area and the blue coronal hole area, with green representing a match and red/blue indicating that there is area in the red/blue contour that does not match. The final column shows the surface rotation rate versus latitude using in this study in black, with the best fit rotation profile in red. The average fit parameters from all three retrievals are Ωeq= 463.0 nHz, α2= -26.7 nHz, and α4= -33.1 nHz.
Current usage metrics show cumulative count of Article Views (full-text article views including HTML views, PDF and ePub downloads, according to the available data) and Abstracts Views on Vision4Press platform.
Data correspond to usage on the plateform after 2015. The current usage metrics is available 48-96 hours after online publication and is updated daily on week days.
Initial download of the metrics may take a while.


