Fig. 1.
Download original image
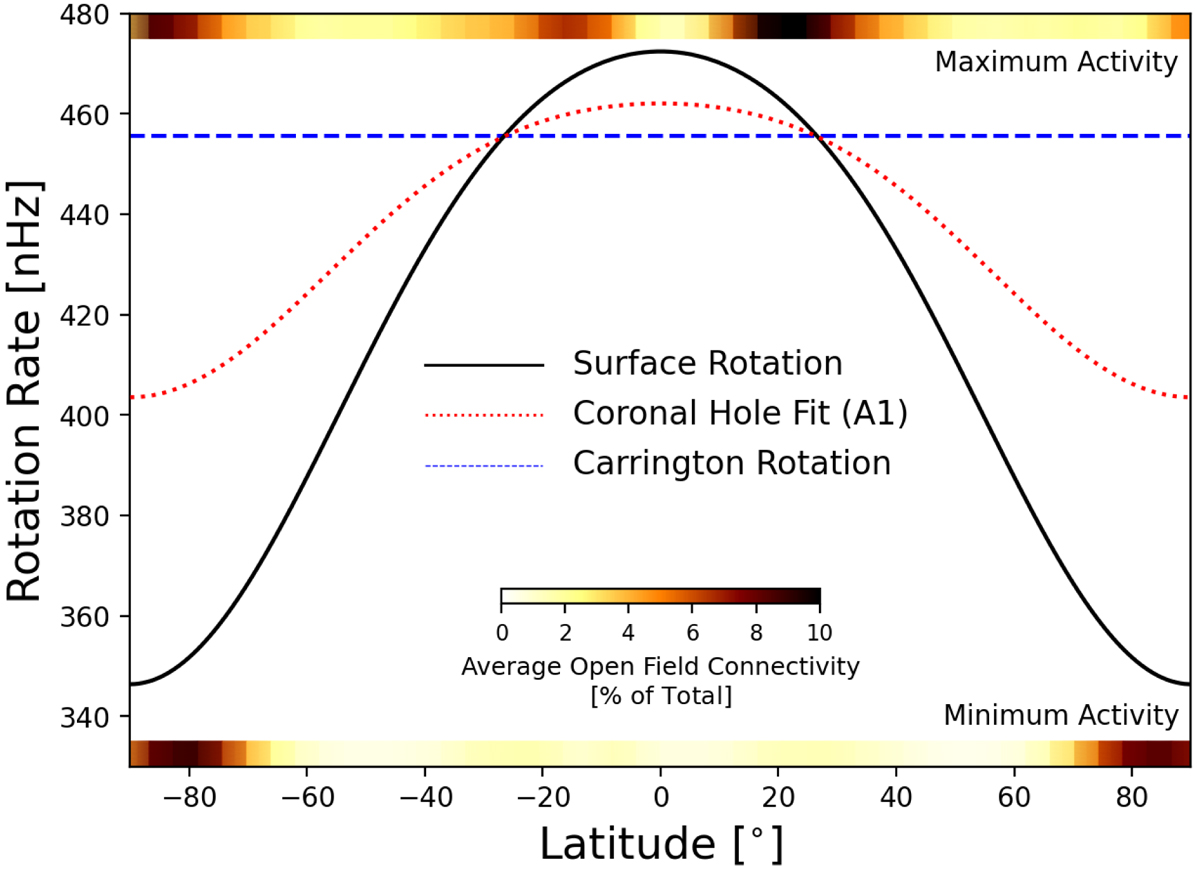
Rotation rate versus heliographic latitude. A typical solar differential rotation pattern is plotted with a solid black line. The rotation rate at θ ≈ 26.5°, otherwise referred to as the Carrington rotation rate (of 25.4 days or ∼456 nHz), is indicated with a blue dashed horizontal line. A less-extreme differential rotation pattern, taken from fitting the apparent motion of coronal holes in AIA-193A synoptic images (see Appendix A), is plotted with a red dotted line. At the top and bottom of the figure, the latitudinal distribution of the source regions of the open magnetic field during the maximum activity and minimum activity periods of solar cycle 24, respectively, are indicated (further explored in Fig. 4). During periods of low activity, the sources of the open magnetic field are confined to the slowly rotating poles. In periods of higher activity, the open field emerges more frequently from low-latitude features. During solar cycle 24, a north-south asymmetry is also observed during solar maximum.
Current usage metrics show cumulative count of Article Views (full-text article views including HTML views, PDF and ePub downloads, according to the available data) and Abstracts Views on Vision4Press platform.
Data correspond to usage on the plateform after 2015. The current usage metrics is available 48-96 hours after online publication and is updated daily on week days.
Initial download of the metrics may take a while.