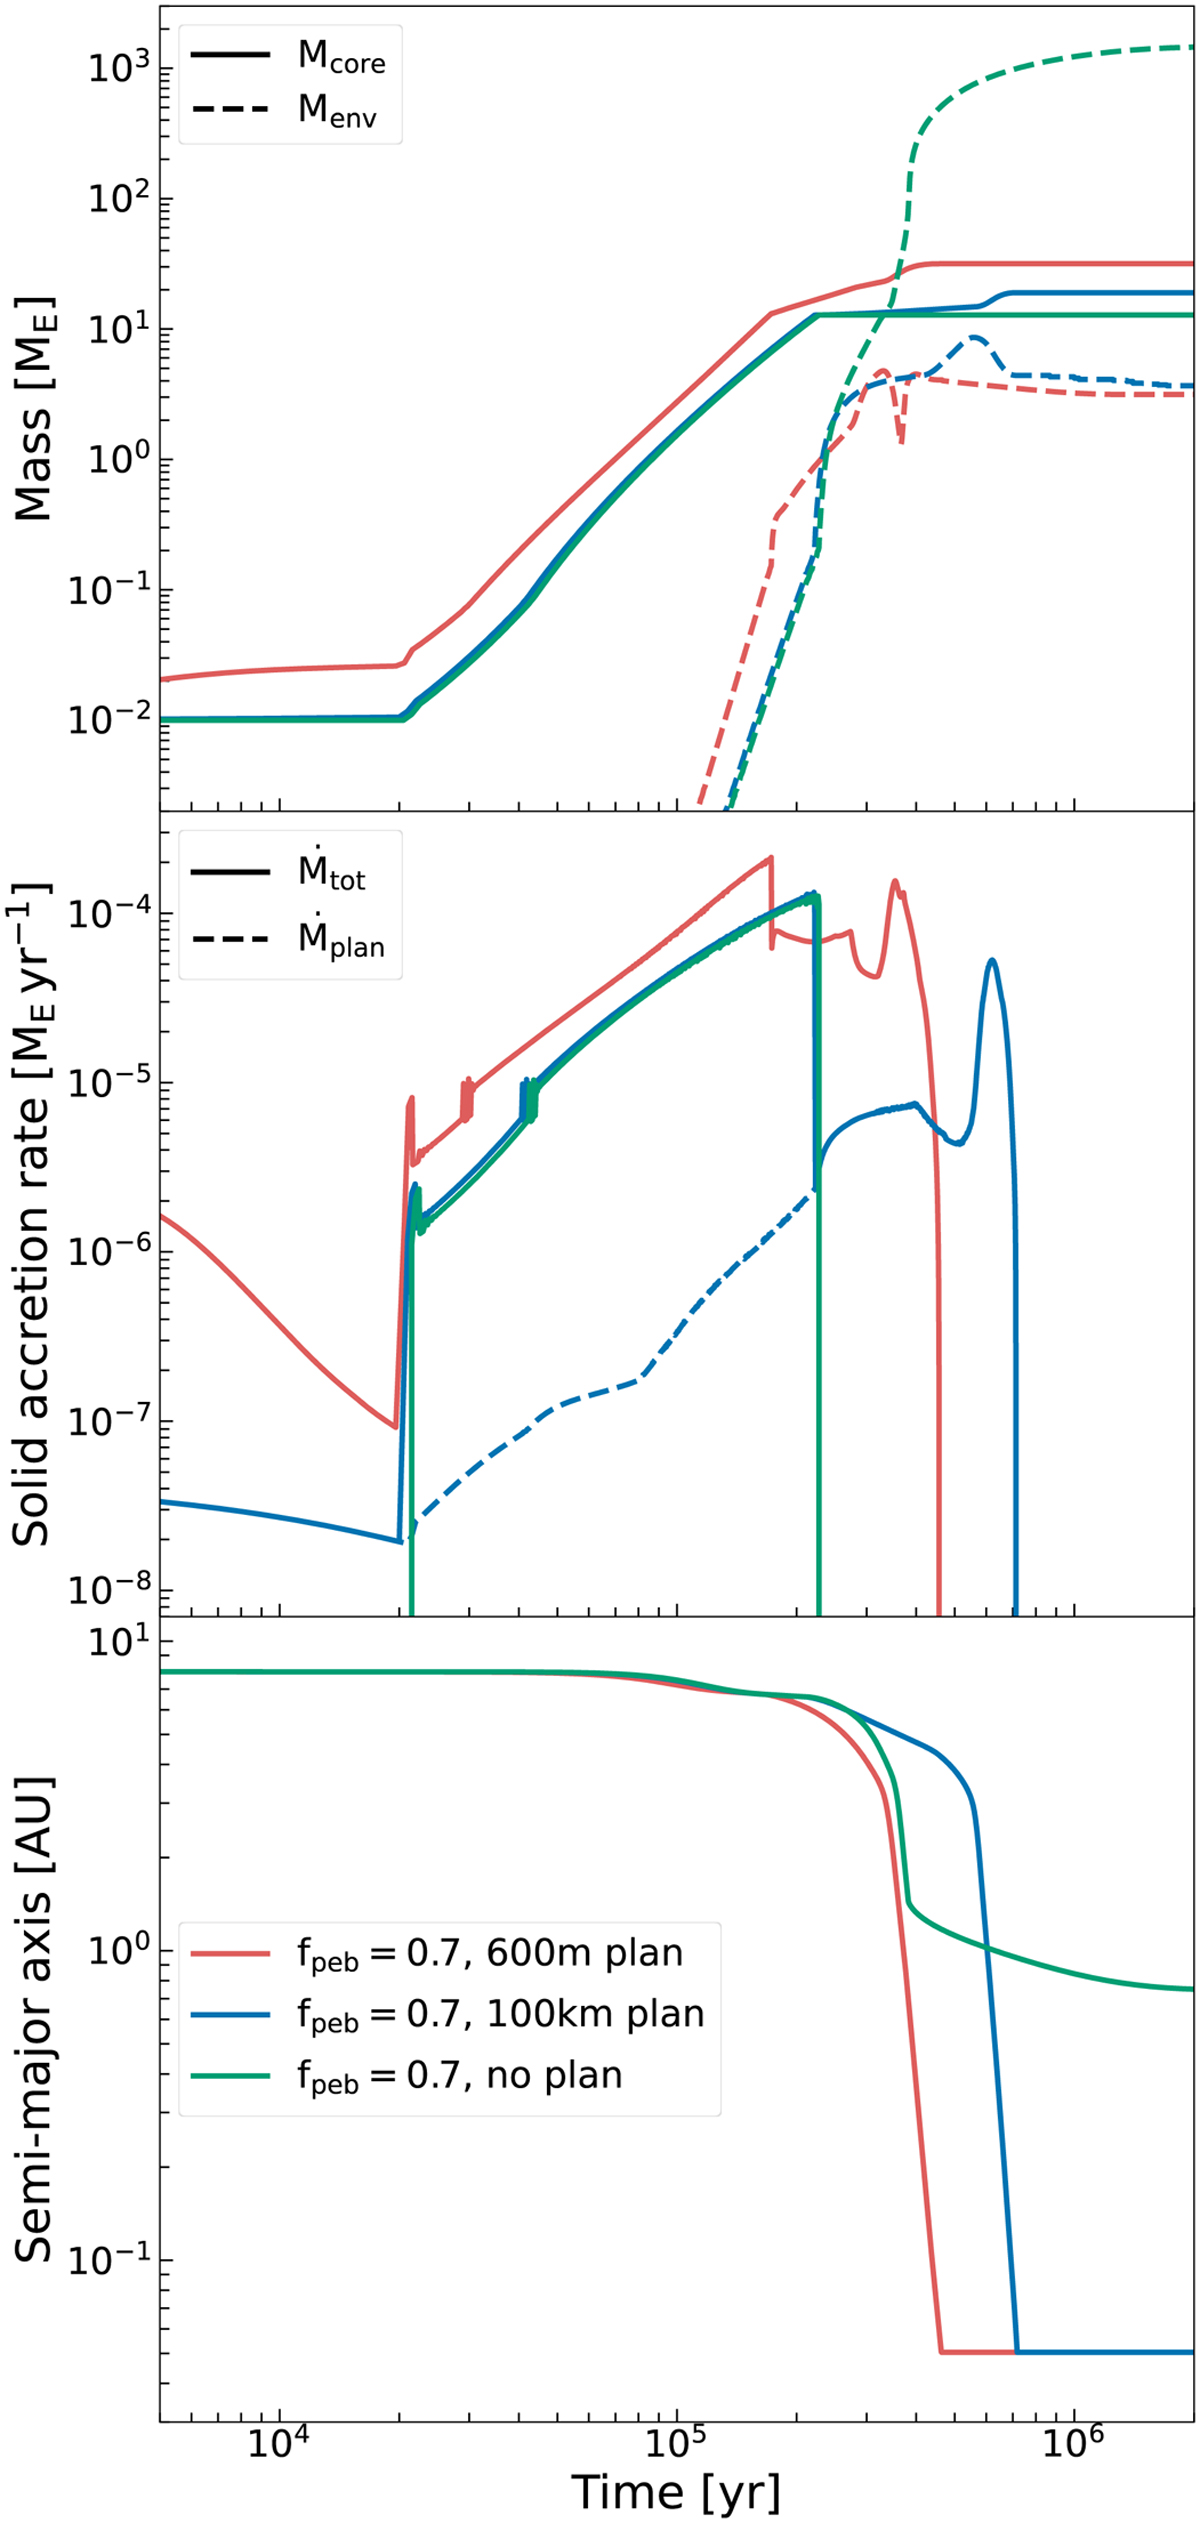
Fig. 4
Download original image
Time evolution of a planet forming in a fpeb = 0.7 disk with 100 km planetesimals (blue) and disabled planetesimal accretion (green). The nominal fpeb = 0.7 case using 600 m planetesimals (red) is again shown for comparison. The top panel shows the core mass (solid lines) and the envelope mass (dashed lines), the middle panel shows the total core accretion rate (solid lines) and the planetesimal accretion rate (dashed line). In the bottom panel, the semi-major axis over time is displayed.
Current usage metrics show cumulative count of Article Views (full-text article views including HTML views, PDF and ePub downloads, according to the available data) and Abstracts Views on Vision4Press platform.
Data correspond to usage on the plateform after 2015. The current usage metrics is available 48-96 hours after online publication and is updated daily on week days.
Initial download of the metrics may take a while.