Open Access
Fig. 7.
Download original image
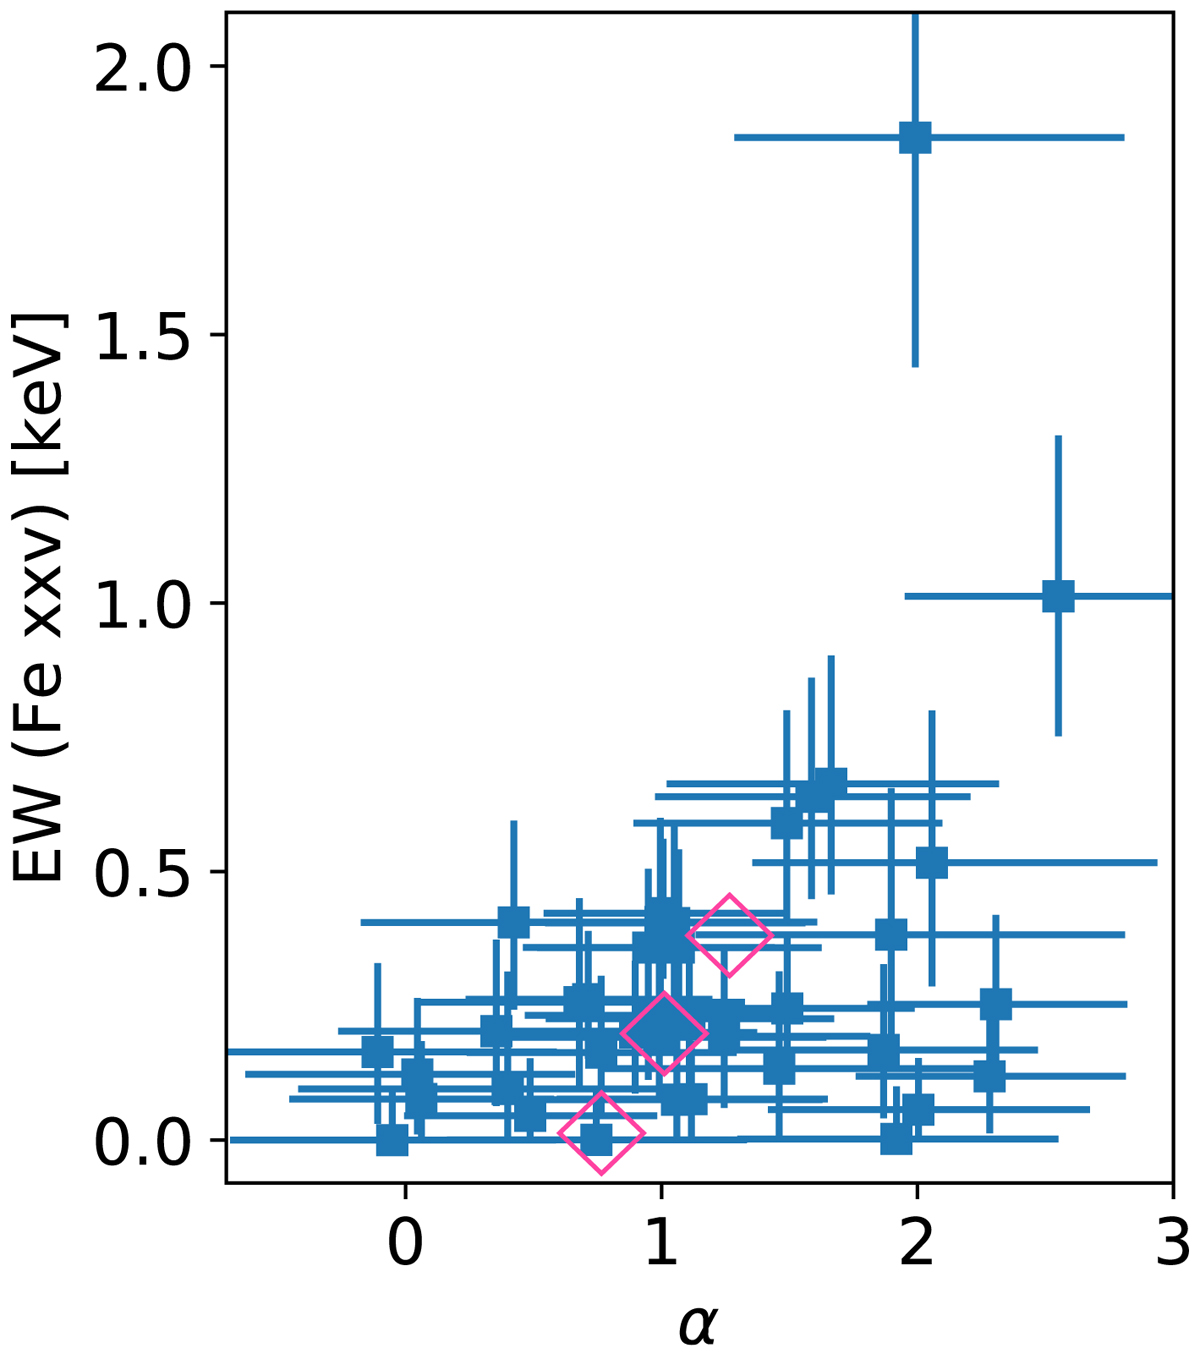
Plot of EW (Fe XXV) against continuum slope α of the 38 region segments (in blue filled-squares). The three magenta diamonds indicate the points for the EW-binned spectra (Table 3), where EW value of each point is the median of EWs measured in the spectra that went into each bin.
Current usage metrics show cumulative count of Article Views (full-text article views including HTML views, PDF and ePub downloads, according to the available data) and Abstracts Views on Vision4Press platform.
Data correspond to usage on the plateform after 2015. The current usage metrics is available 48-96 hours after online publication and is updated daily on week days.
Initial download of the metrics may take a while.