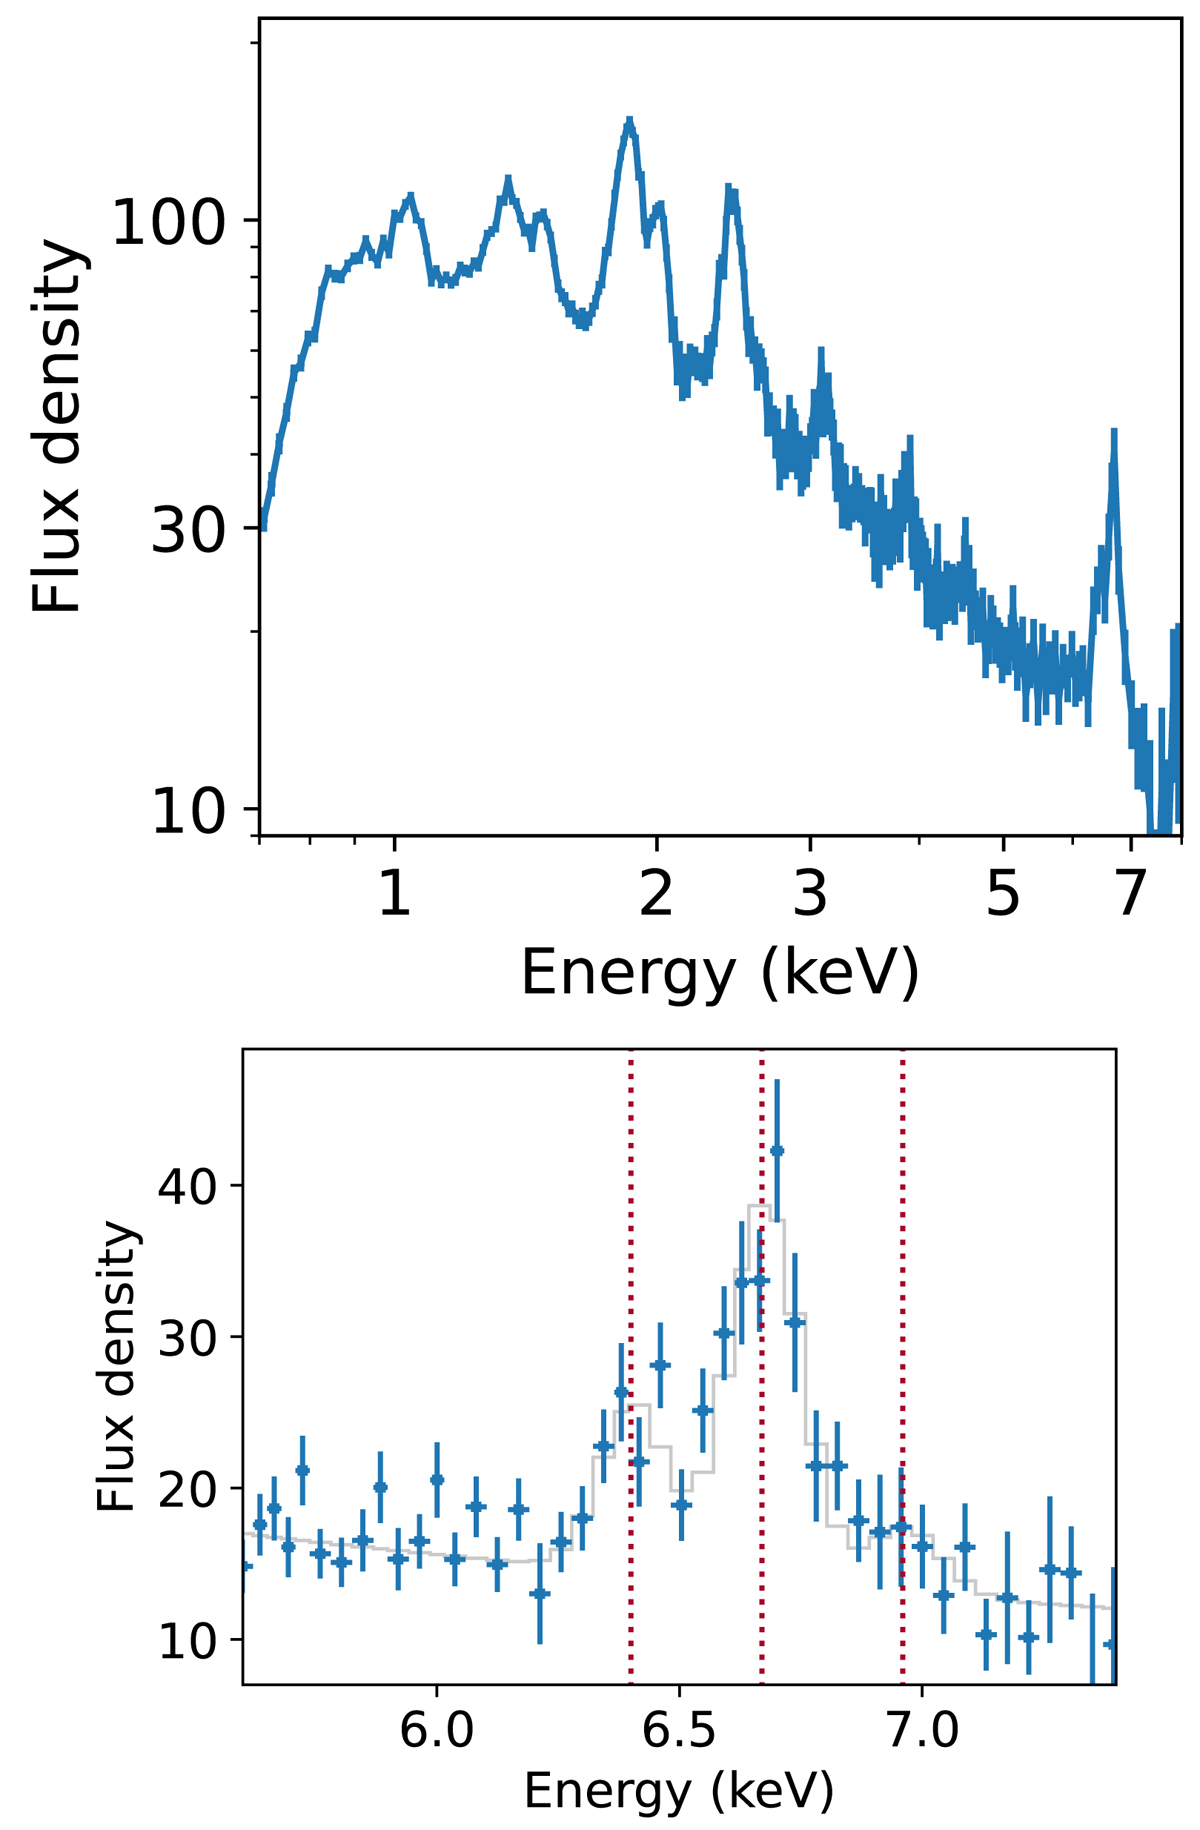
Fig. 2.
Download original image
Diffuse emission spectrum of the central part of M 82, obtained from the Chandra ACIS-S. The flux density is in units of 10−14 erg s−1 cm−2 keV−1. Upper panel: The 0.7−8 keV spectrum. Lower panel: The Fe K band spectrum of the same data. The three vertical dotted-lines indicates the expected centroid energies of 6.4 keV, 6.7 keV and 6.96 keV for cold Fe K, Fe XXV and Fe XXVI, respectively. The grey line indicates the fitted model of a power-law and three Gaussian lines.
Current usage metrics show cumulative count of Article Views (full-text article views including HTML views, PDF and ePub downloads, according to the available data) and Abstracts Views on Vision4Press platform.
Data correspond to usage on the plateform after 2015. The current usage metrics is available 48-96 hours after online publication and is updated daily on week days.
Initial download of the metrics may take a while.