Fig. A.1.
Download original image
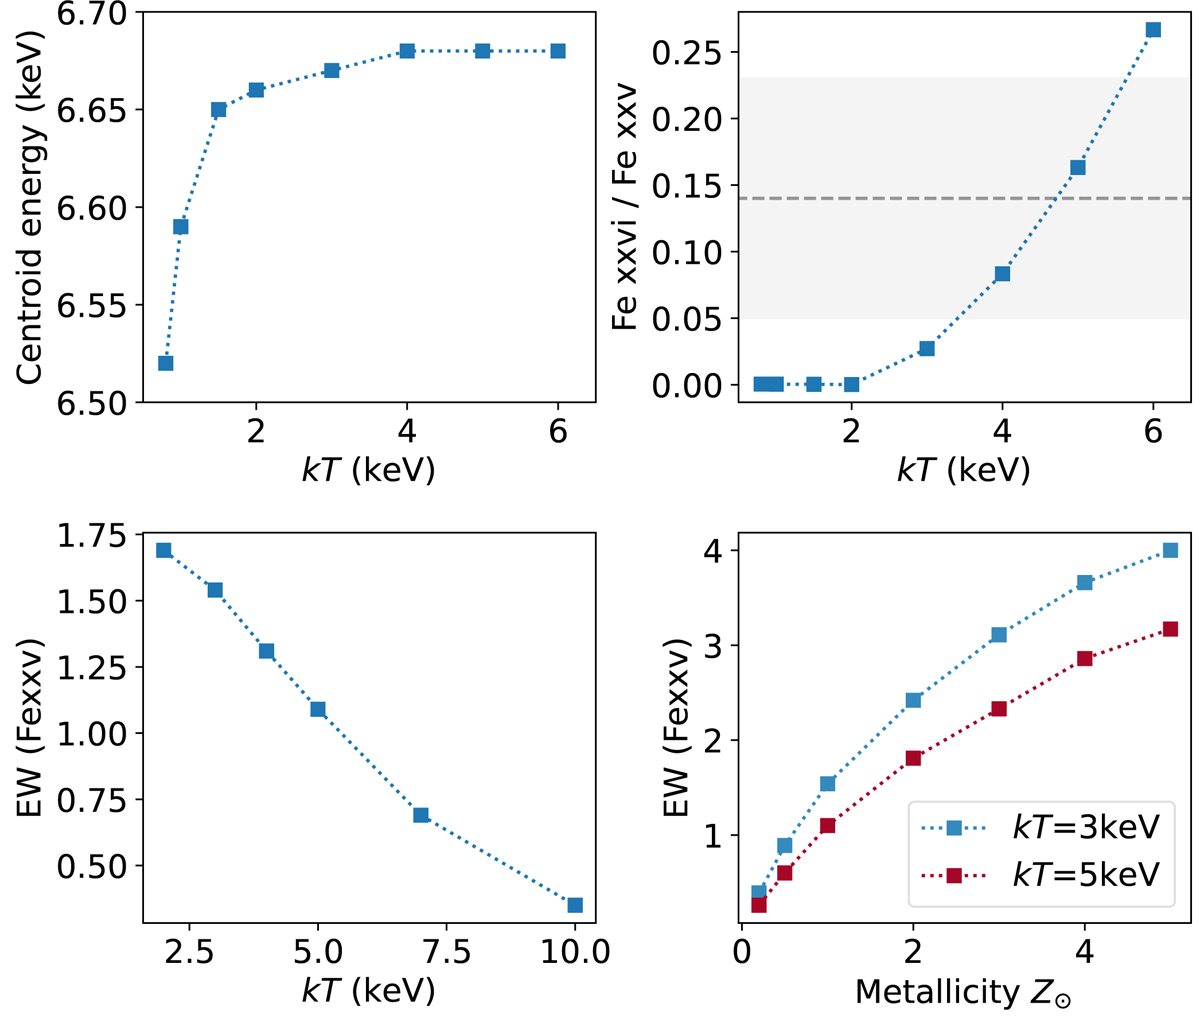
Fe K line properties of thermal emission spectrum. Top-left: Line centroid energy as a function of gas temperature; Top-right: Line intensity ratio of Fe XXVI and Fe XXV as a function of gas temperature. The dashed-line indicates the observed line ratio with 68% error region in grey shade; Bottom-left: Fe XXV EW as a function of temperature when the Solar metallity is assumed; and Bottom-right: Fe XXV EW as a function of metallicity for gas temperature of kT = 3 keV (blue) and kT = 5 keV (red).
Current usage metrics show cumulative count of Article Views (full-text article views including HTML views, PDF and ePub downloads, according to the available data) and Abstracts Views on Vision4Press platform.
Data correspond to usage on the plateform after 2015. The current usage metrics is available 48-96 hours after online publication and is updated daily on week days.
Initial download of the metrics may take a while.