Fig. 12.
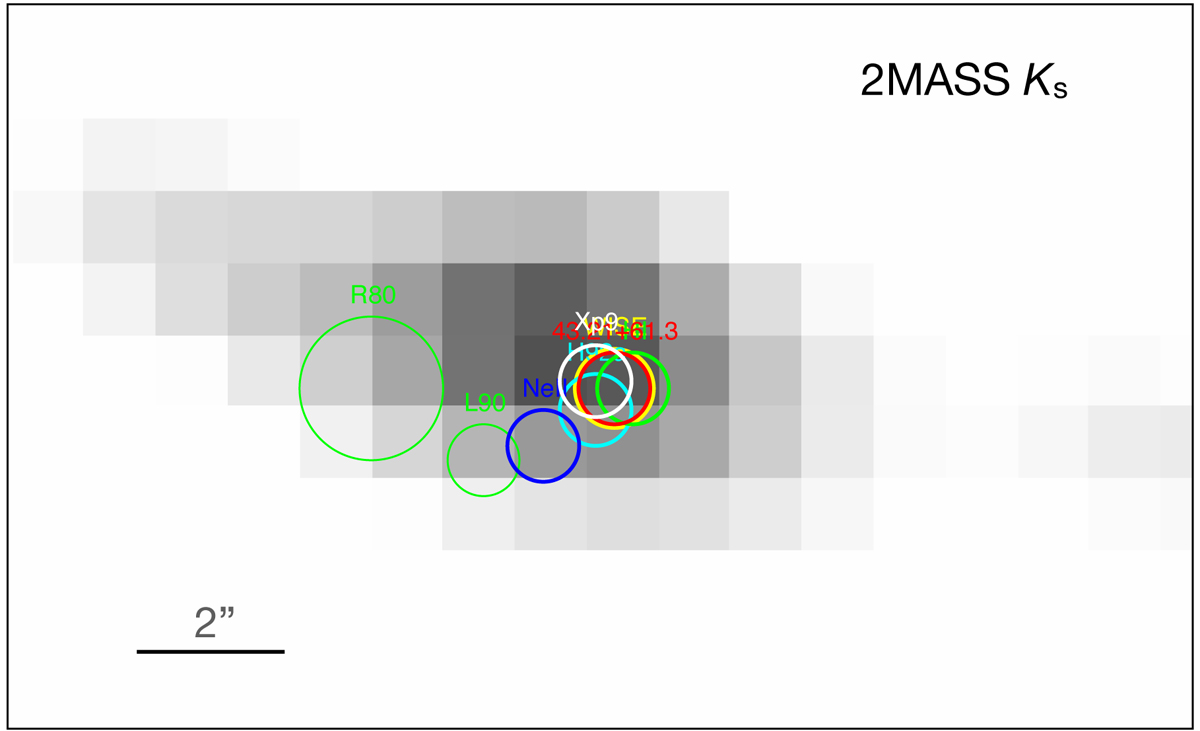
Download original image
Ks band image of the M 82 nuclear peak emission obtained from 2MASS in grey scale (fainter emission is cut out), overplotted by positions of the X-ray source, Xp9 (white), radio source 43.21+61.3 (red; Rodriguez-Rico et al. 2004), H I kinematic centre (green; Weliachew et al. 1984), Ne II kinematic centre (blue; Achtermann & Lacy 1995), H92α ring centre (cyan; Rodriguez-Rico et al. 2004), WISE peak (yellow; Jarrett et al. 2019), and two previous 2.2 μm peak measurements (R80: Rieke et al. 1980; L90: Lester et al. 1990). The positional error is ∼0.5″ for each measurement, which is represented by the circle, apart from the 2.2 μm position of Rieke et al. (1980). The image orientation is north up, east to the left.
Current usage metrics show cumulative count of Article Views (full-text article views including HTML views, PDF and ePub downloads, according to the available data) and Abstracts Views on Vision4Press platform.
Data correspond to usage on the plateform after 2015. The current usage metrics is available 48-96 hours after online publication and is updated daily on week days.
Initial download of the metrics may take a while.