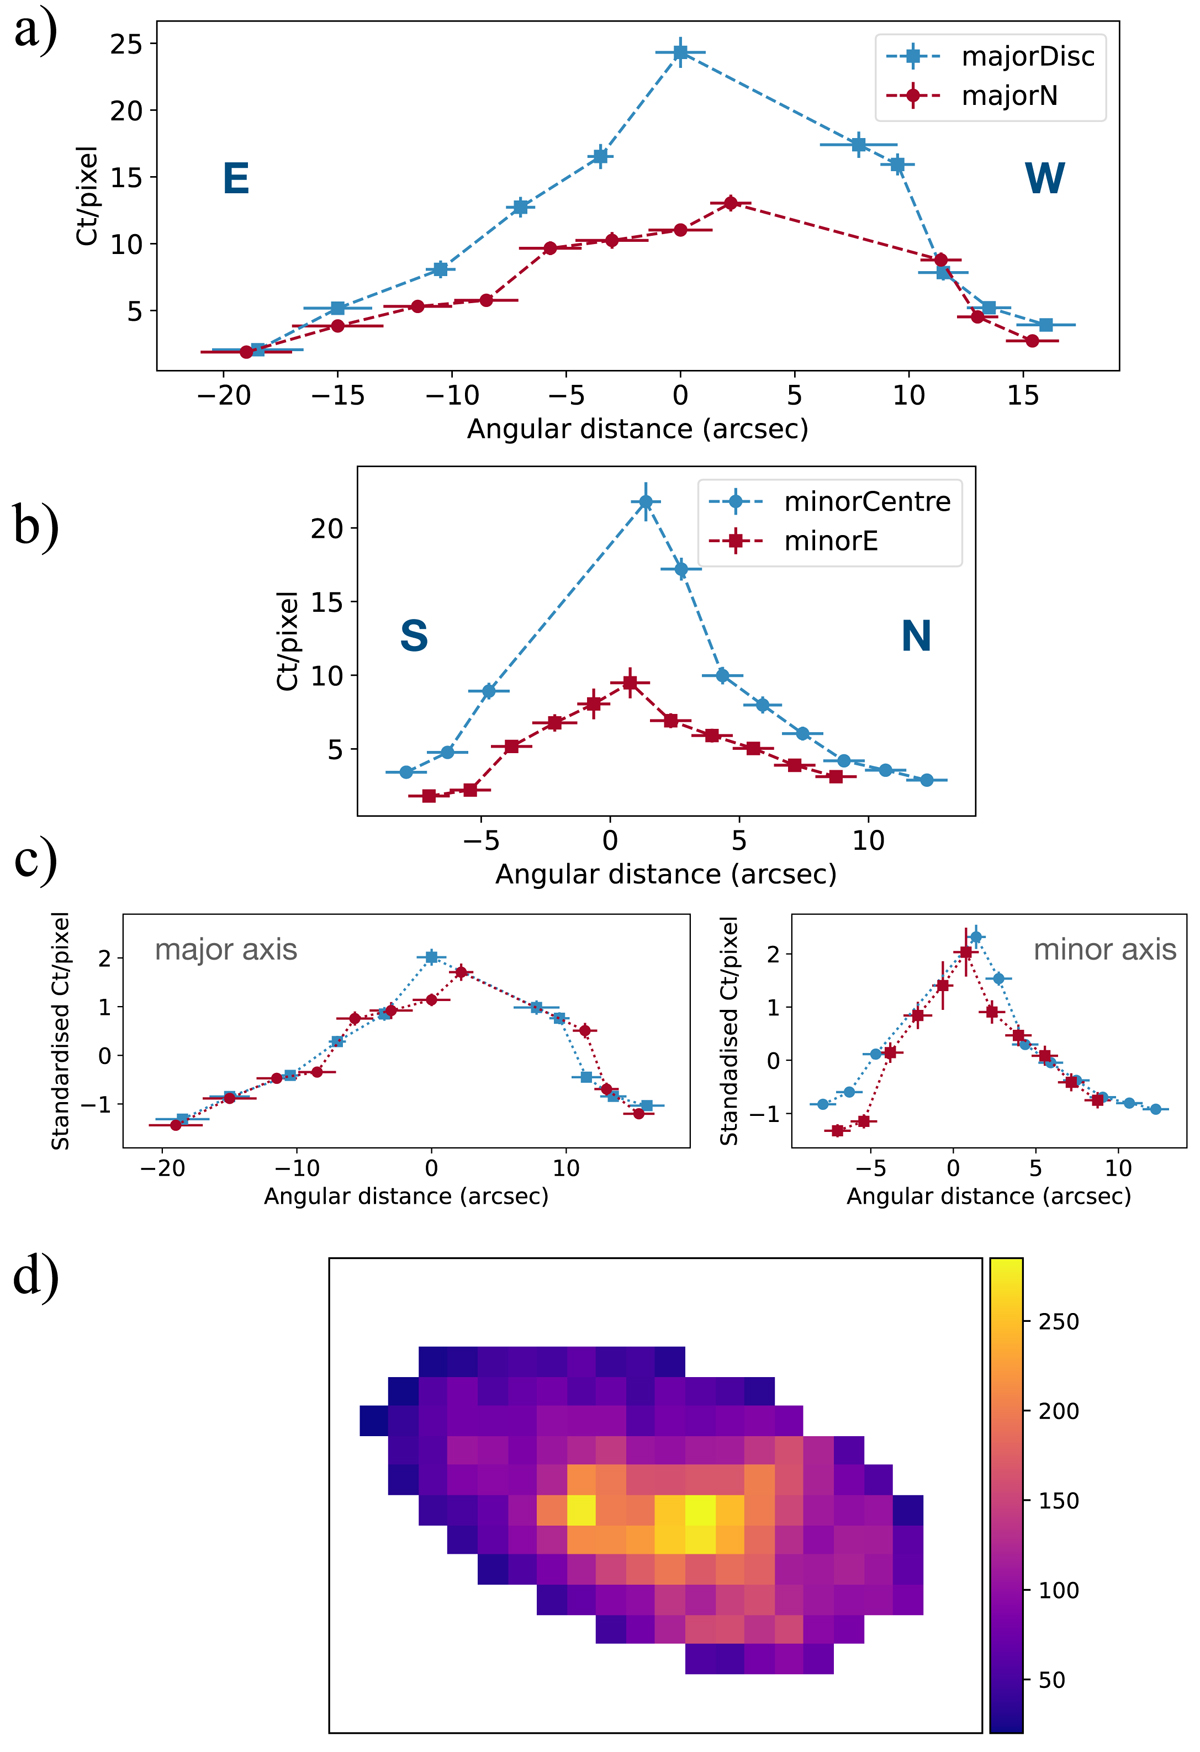
Fig. 10.
Download original image
Light distribution in the 4−8 keV band. (a) The 4−8 keV projected light profiles along the major axis taken from the strips shown in Fig. 9. (b) The profiles along the minor axis. (c) These two panels show the same profiles but standardised for a comparison of their shapes. (d) The 4−8 keV diffuse emission image, constructed by two-dimensional interpolation from the point source masked image. Each pixel has an ≈2 × 2 arcsec2 size and the colour bar indicates the brightness scale in units of counts per pixel.
Current usage metrics show cumulative count of Article Views (full-text article views including HTML views, PDF and ePub downloads, according to the available data) and Abstracts Views on Vision4Press platform.
Data correspond to usage on the plateform after 2015. The current usage metrics is available 48-96 hours after online publication and is updated daily on week days.
Initial download of the metrics may take a while.