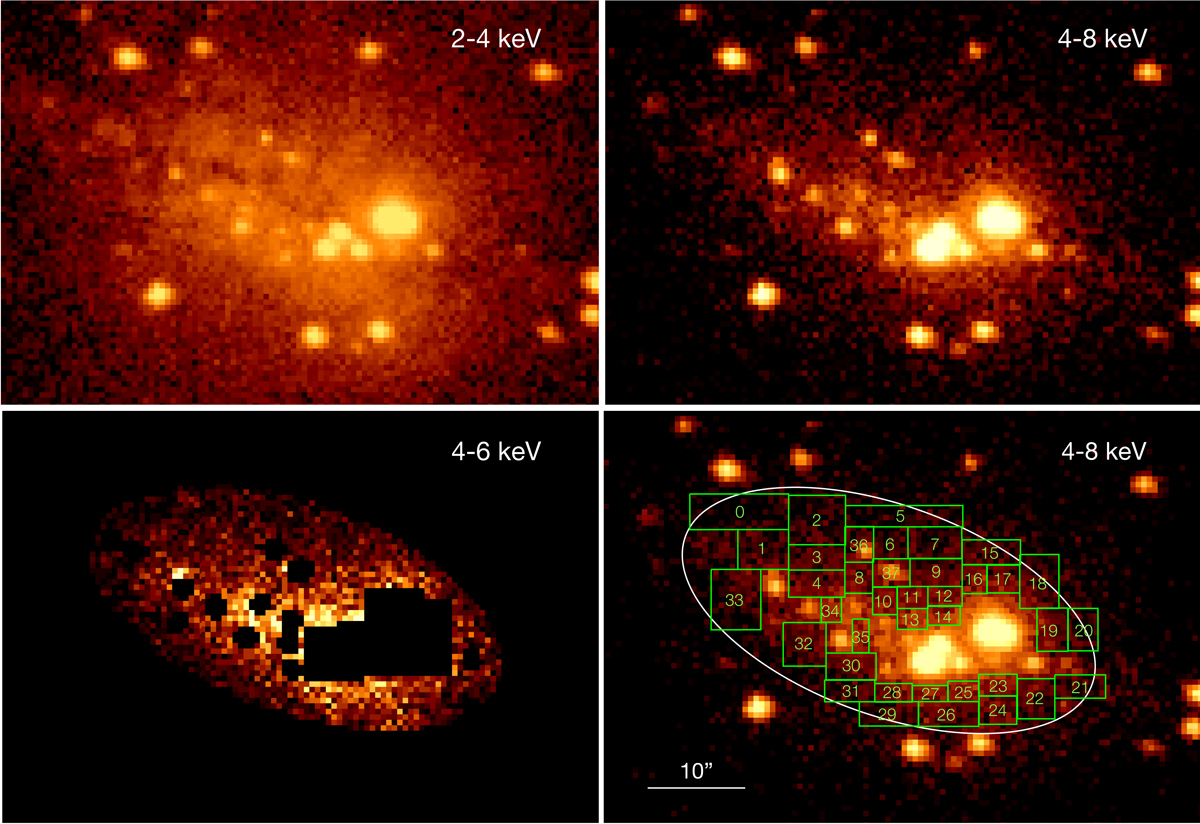
Fig. 1.
Download original image
Chandra X-ray images of the central part of M 82 integrated over the 13 observations. Top left: 2−4 keV image. Top right: 4−8 keV band. The colour scale of these two images is in logarithmic with the brightest point sources are saturated. Bottom left: The 4−6 keV image of the ellipse where the data of the diffuse emission spectrum were taken. The detected discrete sources were masked. The region where the brightest ULXs along with a few others are clustered is masked in a block. This image is in a linear scale as the dynamic range of the brightness is narrow: 1−19, as a result of the removal of discrete sources. Bottom right: The same image as top right overlaid by the ellipse and the 38 region segments for spatially resolved spectral study.
Current usage metrics show cumulative count of Article Views (full-text article views including HTML views, PDF and ePub downloads, according to the available data) and Abstracts Views on Vision4Press platform.
Data correspond to usage on the plateform after 2015. The current usage metrics is available 48-96 hours after online publication and is updated daily on week days.
Initial download of the metrics may take a while.