Fig. 7
Download original image
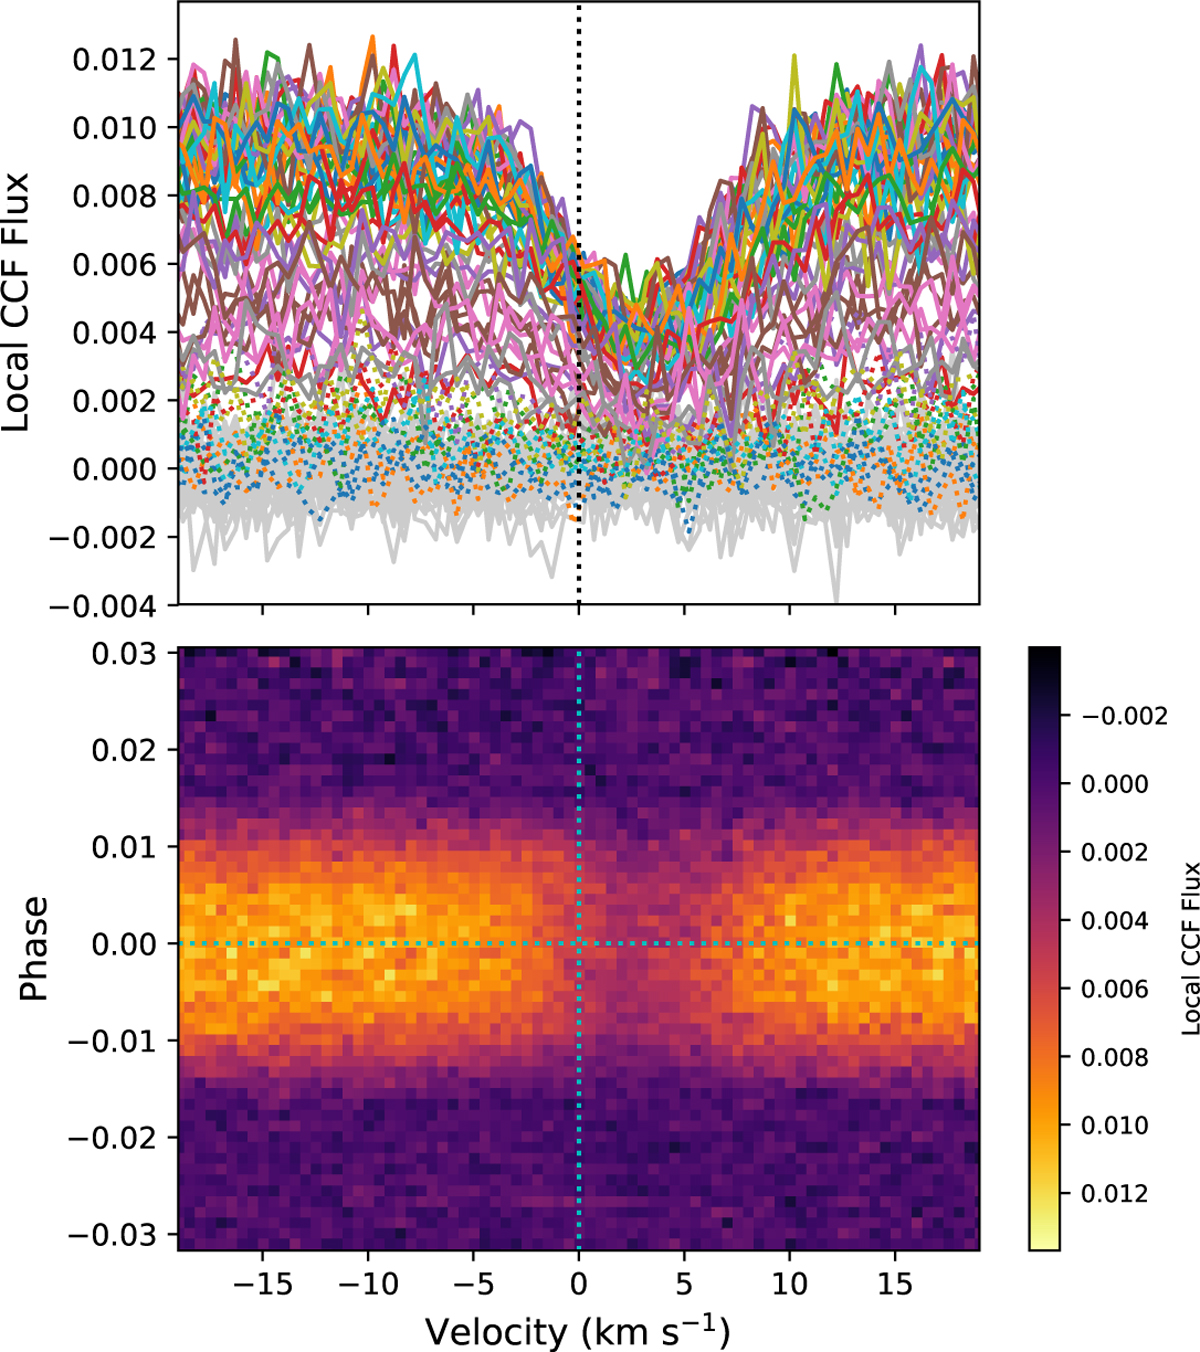
Local stellar CCFs, behind the transiting planet (i.e. CCFout – CCFin), for HAT-P-30. Top: plotted in various colours in the stellar rest frame (indicated by a dotted vertical line); the two in-transit local CCFs that fail the signal-to-noise test are shown as dashed lines. Individual out-of-transit CCFs subtracted from the master CCFout are displayed in grey. Bottom: plotted as a function of phase and colour-coded by the flux; a further horizontal dashed line indicates zero phase.
Current usage metrics show cumulative count of Article Views (full-text article views including HTML views, PDF and ePub downloads, according to the available data) and Abstracts Views on Vision4Press platform.
Data correspond to usage on the plateform after 2015. The current usage metrics is available 48-96 hours after online publication and is updated daily on week days.
Initial download of the metrics may take a while.