Open Access
Fig. 6
Download original image
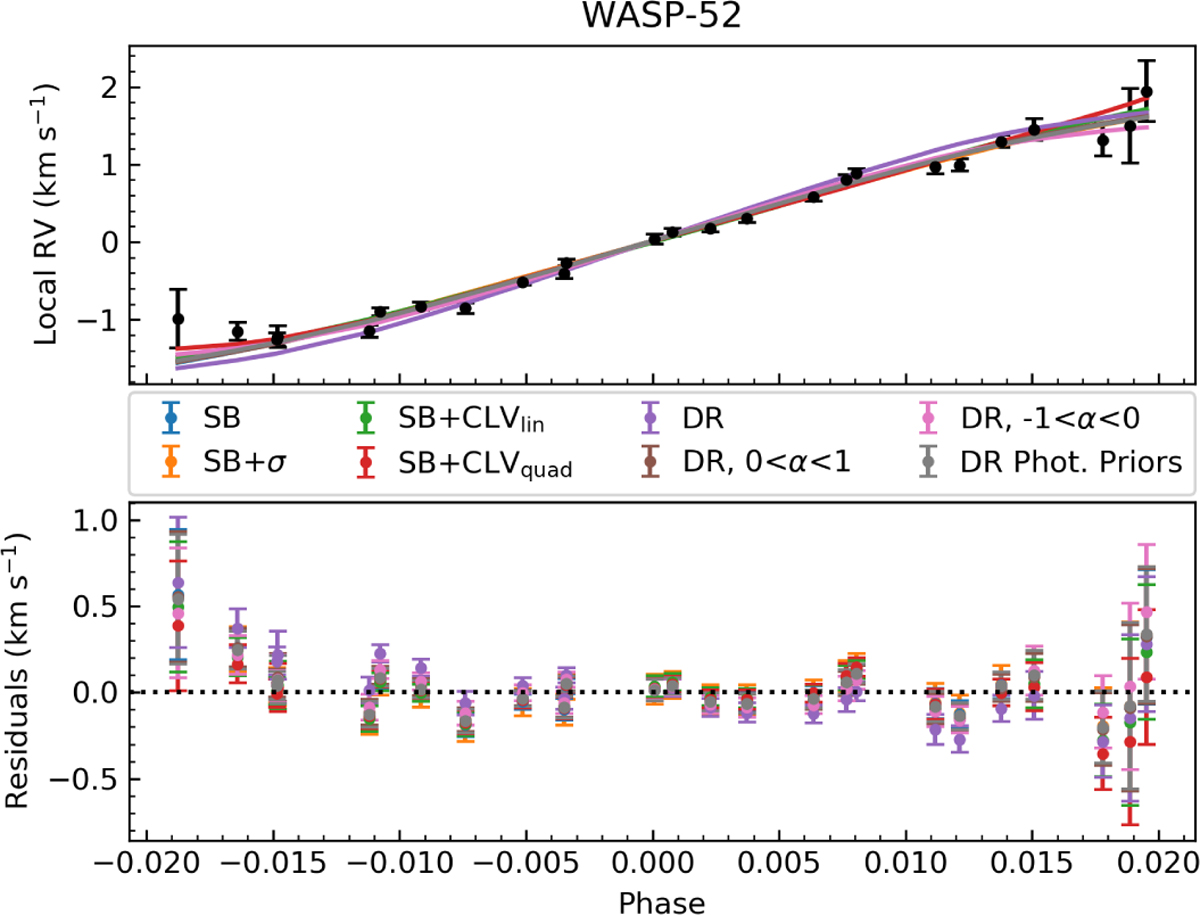
Top: local RVs as a function of phase (in black), over-plotted with the various model fits for the velocity contributions behind WASP-52 b along the transit chord. Bottom: residuals between the measured local RVs and the aforementioned model fits, with a dotted line at 0 km s−1 to guide the eye.
Current usage metrics show cumulative count of Article Views (full-text article views including HTML views, PDF and ePub downloads, according to the available data) and Abstracts Views on Vision4Press platform.
Data correspond to usage on the plateform after 2015. The current usage metrics is available 48-96 hours after online publication and is updated daily on week days.
Initial download of the metrics may take a while.