Open Access
Fig. 4
Download original image
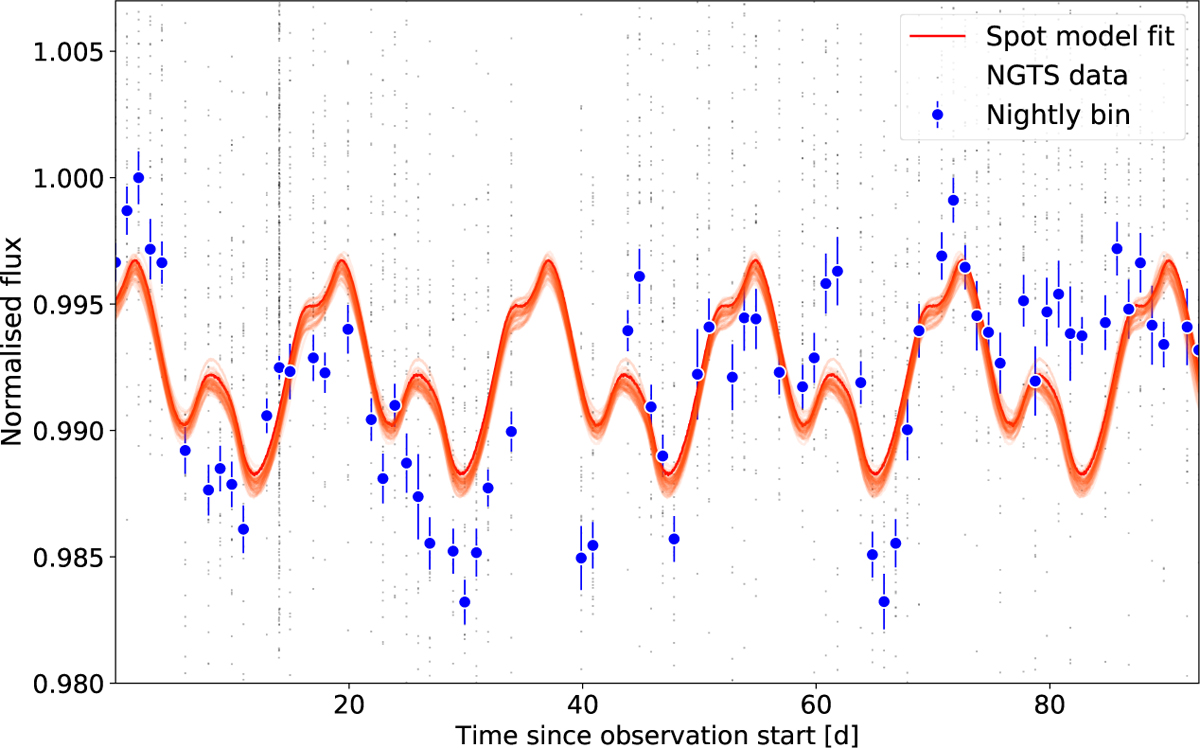
Three-spot model fit to the NGTS photometry of WASP-52. The data is binned per night and the red curves show random samples from the posterior distribution; spot evolution, which is unaccounted for in SOAP, is the most likely reason for the divergence in fit.
Current usage metrics show cumulative count of Article Views (full-text article views including HTML views, PDF and ePub downloads, according to the available data) and Abstracts Views on Vision4Press platform.
Data correspond to usage on the plateform after 2015. The current usage metrics is available 48-96 hours after online publication and is updated daily on week days.
Initial download of the metrics may take a while.