Fig. B.8
Download original image
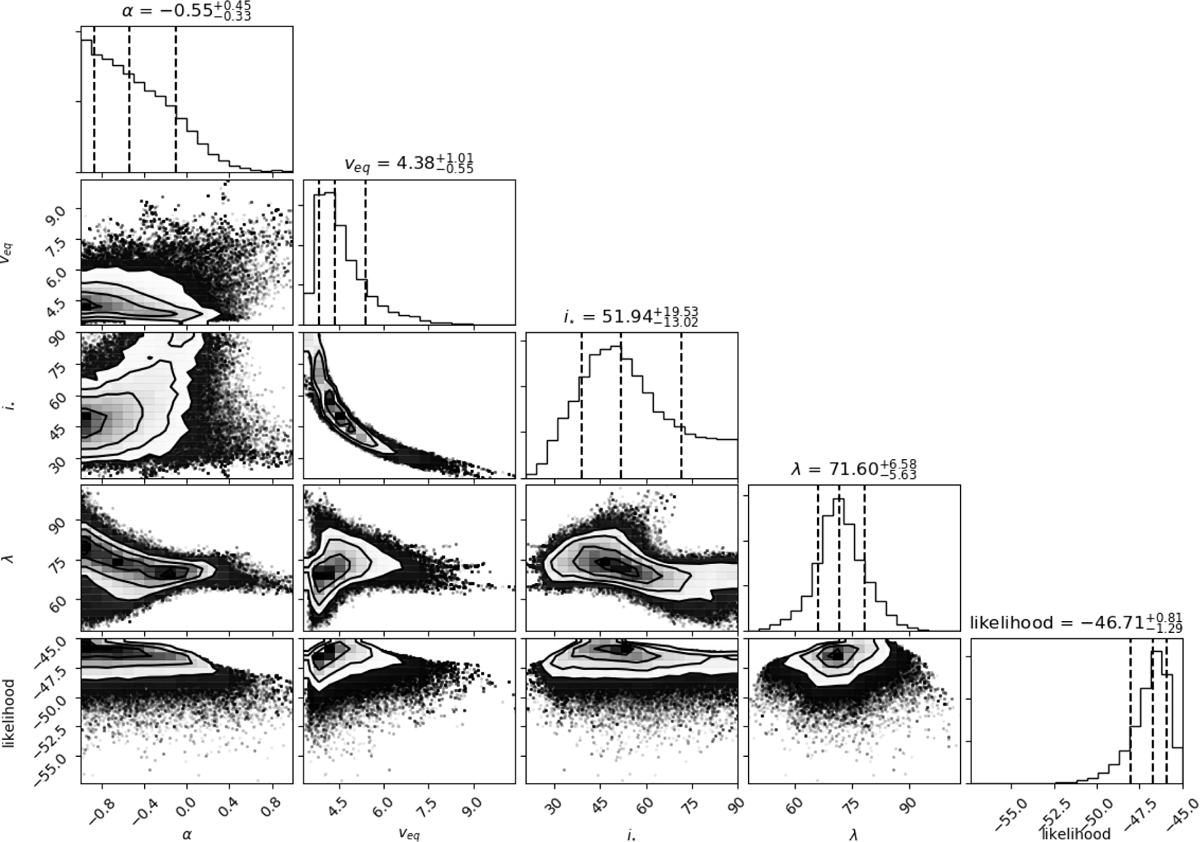
HAT-P-30 corner plot for differential stellar rotation, assuming a stellar inclination pointing towards the line-of-sight (DR, 0 ≤ i* ≤ 90); displayed are the one and two dimensional projections of the posterior probability distributions and their corresponding log-normal likelihood estimates. Vertical dashed lines correspond to the median values and their respective 1σ uncertainties calculated from the 16th, 50th, and 84th percentiles of the samples.
Current usage metrics show cumulative count of Article Views (full-text article views including HTML views, PDF and ePub downloads, according to the available data) and Abstracts Views on Vision4Press platform.
Data correspond to usage on the plateform after 2015. The current usage metrics is available 48-96 hours after online publication and is updated daily on week days.
Initial download of the metrics may take a while.