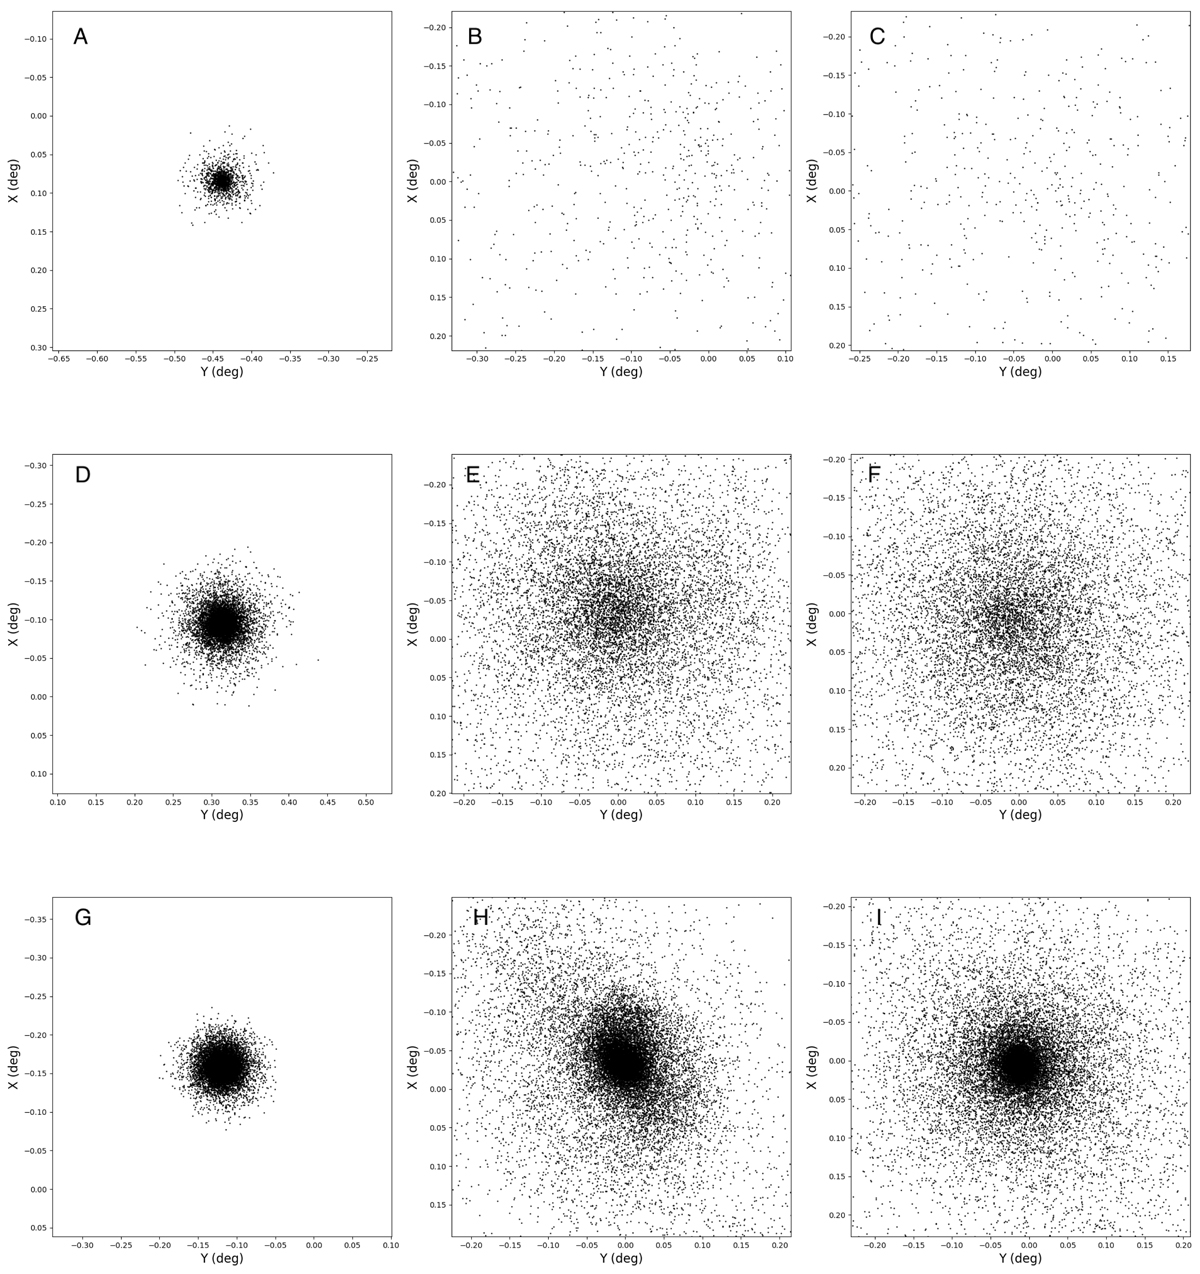
Fig. 5.
Download original image
Spatial distribution of the least concentrated cluster GC3 during the simulation, shown at the top. Middle: intermediate concentration cluster GC26. Bottom: most concentrated cluster GC4. Left plots show the first snapshot of the simulation (t = 0 Myr), while the middle and right plots correspond to t = 8.3 Myr and t = 41.5 Myr, respectively. Complete animations for the simulations are available online.
Current usage metrics show cumulative count of Article Views (full-text article views including HTML views, PDF and ePub downloads, according to the available data) and Abstracts Views on Vision4Press platform.
Data correspond to usage on the plateform after 2015. The current usage metrics is available 48-96 hours after online publication and is updated daily on week days.
Initial download of the metrics may take a while.