Fig. 1.
Download original image
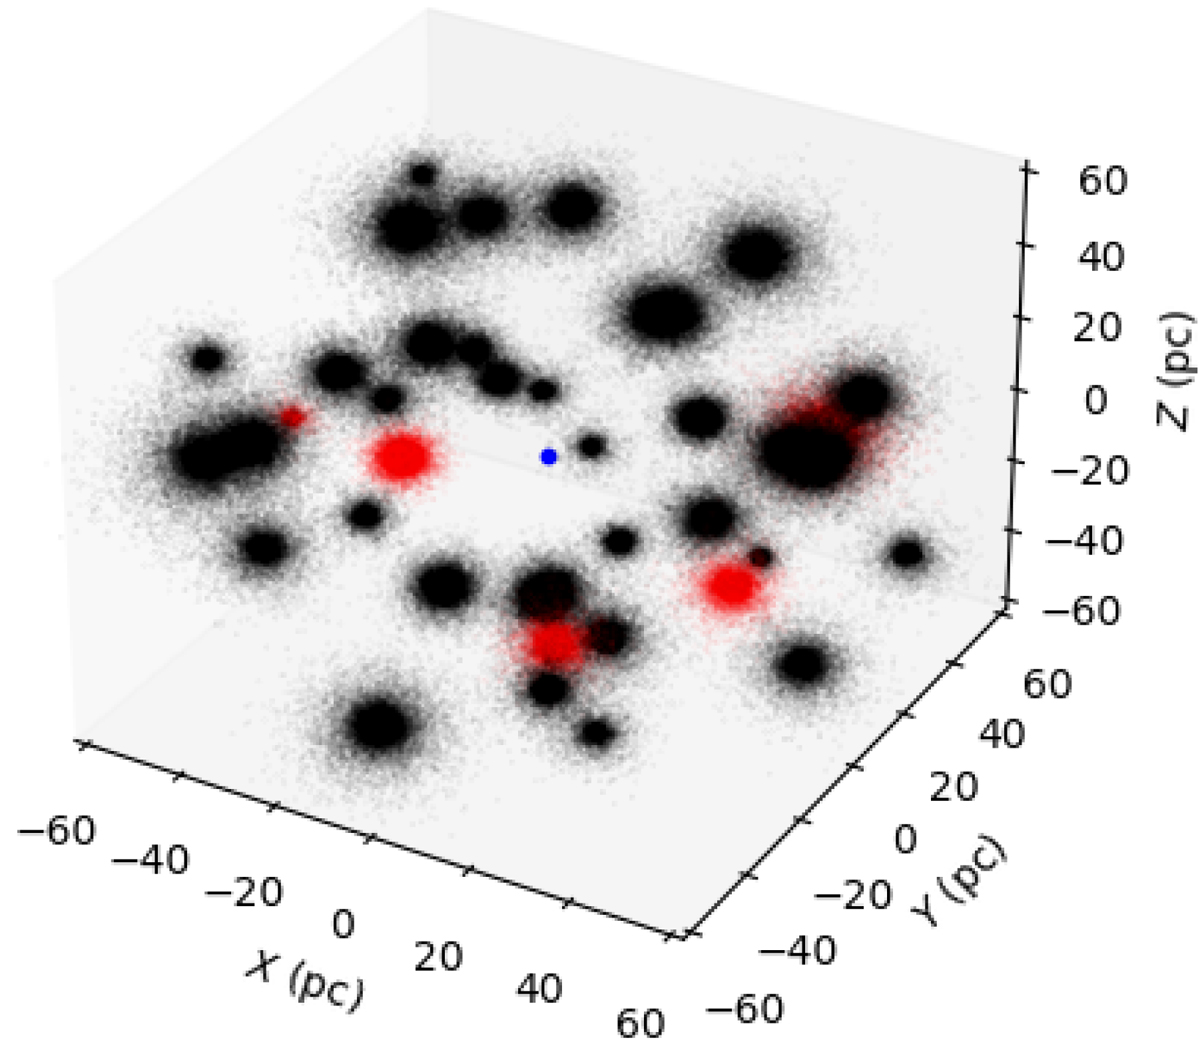
First snapshot of the simulation plotted on a 60 pc scale, including the 41 Globular clusters with a wide range of masses. The blue dot corresponds to the supermassive BH in the center. The red clusters correspond to the clusters analyzed in this article selected according to mass and density, which act as representative samples for the analysis.
Current usage metrics show cumulative count of Article Views (full-text article views including HTML views, PDF and ePub downloads, according to the available data) and Abstracts Views on Vision4Press platform.
Data correspond to usage on the plateform after 2015. The current usage metrics is available 48-96 hours after online publication and is updated daily on week days.
Initial download of the metrics may take a while.