Fig. 9
Download original image
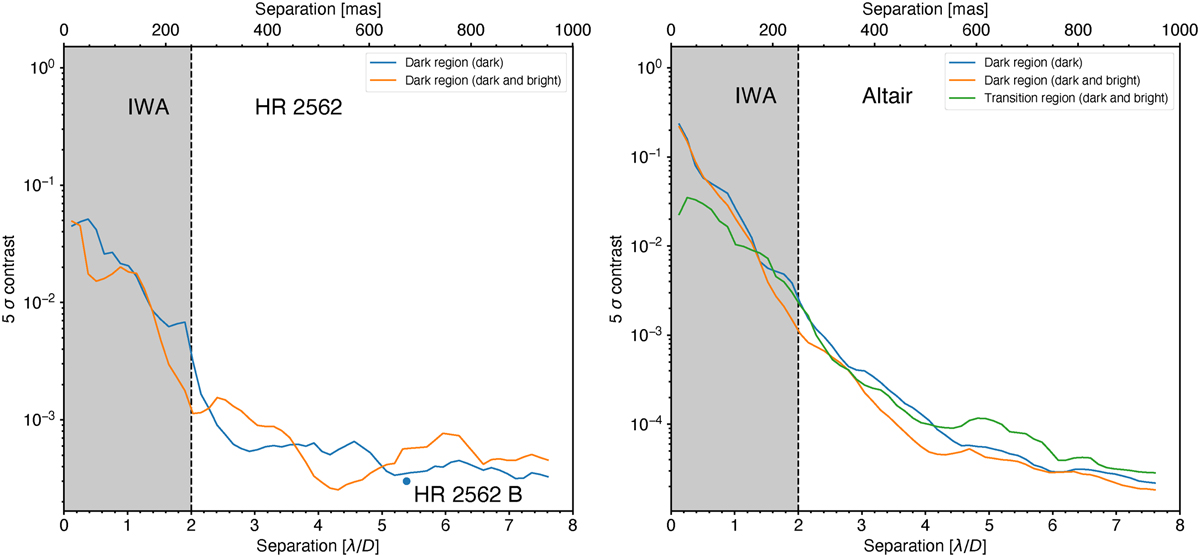
5σ contrast curves of the gvAPP180 datasets with TRAP. The contrast curve is calculated as five times the median of a three-pixel-wide annulus as a function of separation in the normalised uncertainty map. Left panel: the contrast curves of the upper dark region of cube A of the HR 2562 dataset reduced by choosing reference pixels exclusively from the dark hole (labelled as ‘dark’) or both dark and bright sides (labelled as ‘dark and bright’). The detection significance of HR 2562 В is also marked in the figure. Right panel: the contrast curves of the dark region of the Altair dataset reduced by choosing reference pixels only from the dark hole or both dark and bright sides. The contrast curve of the transition region is also compared in the right panel, which is not much worse than that of the dark region.
Current usage metrics show cumulative count of Article Views (full-text article views including HTML views, PDF and ePub downloads, according to the available data) and Abstracts Views on Vision4Press platform.
Data correspond to usage on the plateform after 2015. The current usage metrics is available 48-96 hours after online publication and is updated daily on week days.
Initial download of the metrics may take a while.