Fig. 6
Download original image
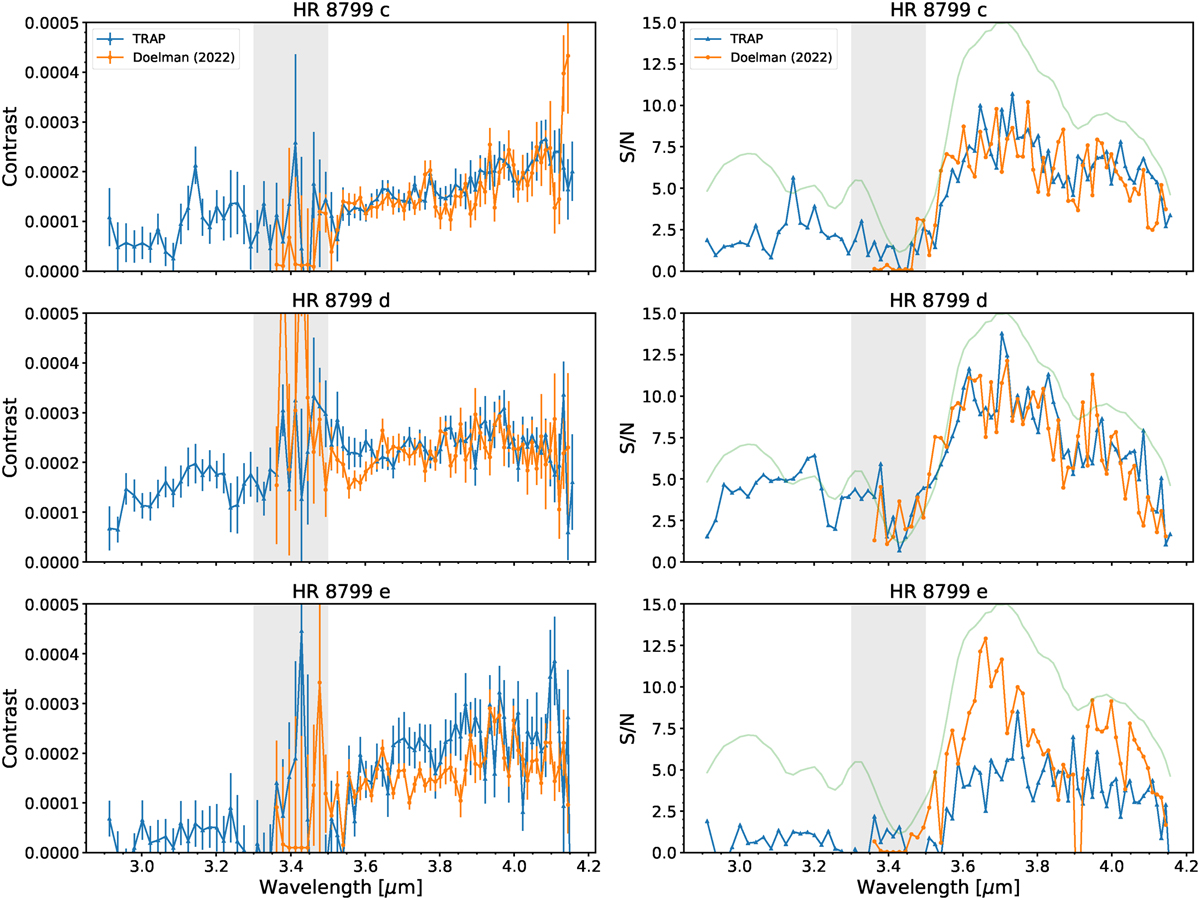
Contrast spectra and S/N comparison of the custom algorithm and TRAP. The results of the custom algorithm are adopted from the published results in Doelman et al. (2022), covering 3.36 to 4.14 μm. Left panel: the extracted spectra of HR 8799 c, d and e by the two algorithms between 2.91 and 4.16 μm. Right panel: the contrast S/N. The light green profile in the right panel is the star flux normalised by its maximum value between 2.91 and 4.16 μm, which is an indicator of the transmission of the dgvAPP360 coronagraph. The grey shaded area shows the absorption band of the coronagraph, where the extracted planet signals are the worst. On average, TRAP achieves slightly higher S/N and smoother contrast spectra for HR 8799 c and d. The custom algorithm achieves higher S/N for HR 8799 e but with a larger deviation between wavelength channels than TRAP.
Current usage metrics show cumulative count of Article Views (full-text article views including HTML views, PDF and ePub downloads, according to the available data) and Abstracts Views on Vision4Press platform.
Data correspond to usage on the plateform after 2015. The current usage metrics is available 48-96 hours after online publication and is updated daily on week days.
Initial download of the metrics may take a while.