Fig. 2
Download original image
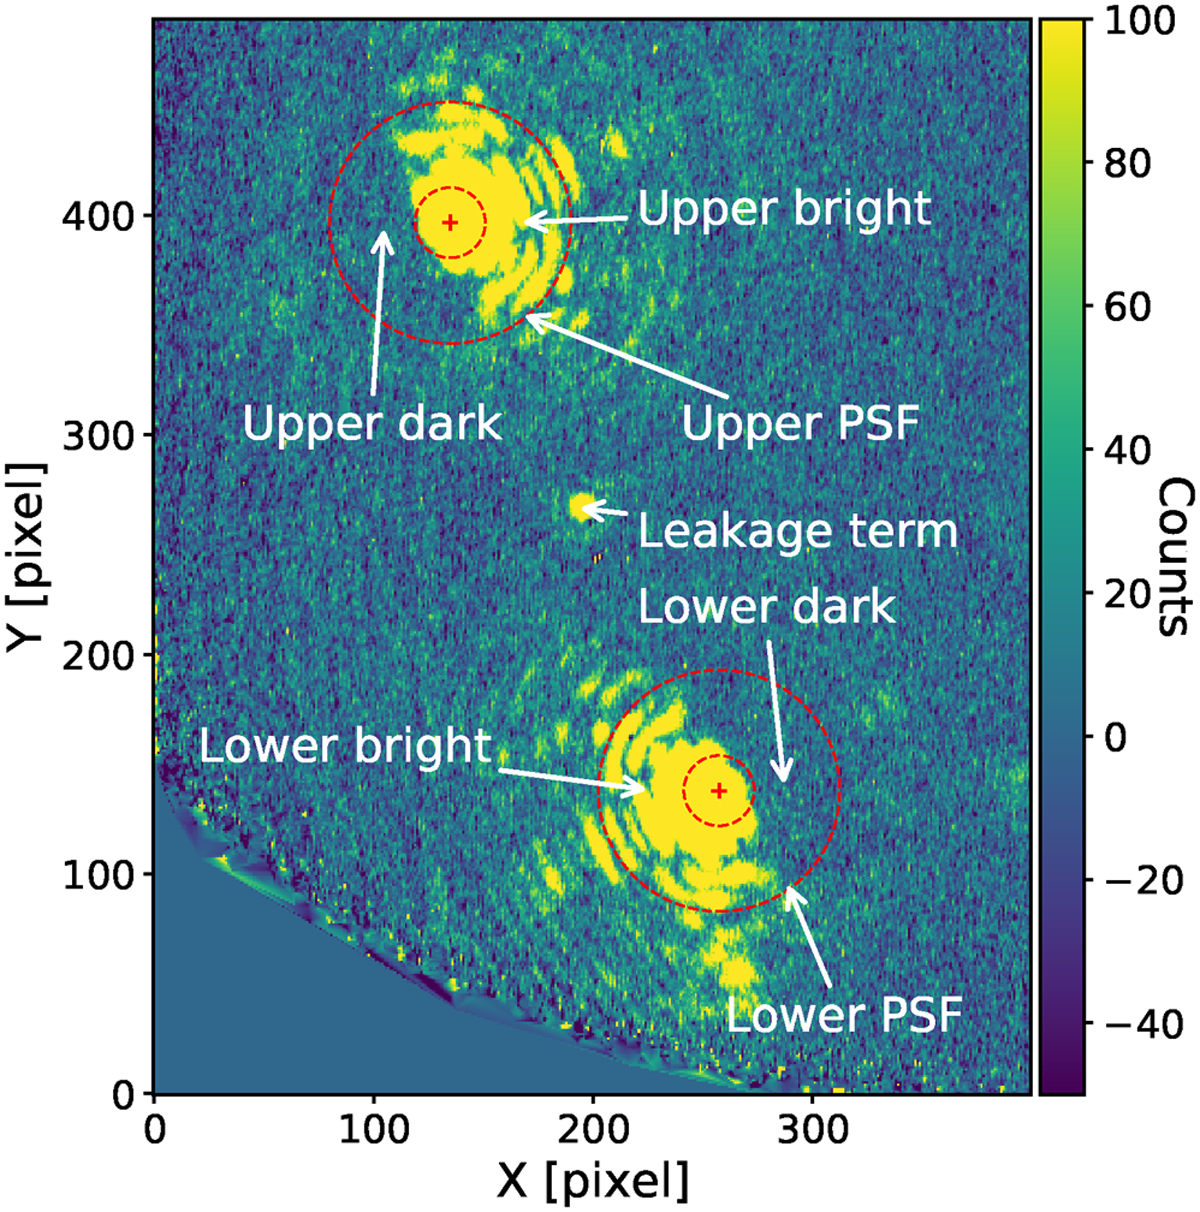
On-sky coronagraphic PSF from the gvAPP180 mounted on MagAO/Clio2 at 3.94 μm. One PSF (upper PSF) is above another PSF (lower PSF) with a leakage term in the middle. The red circles in dashed lines show the IWA and OWA. The dark holes of the two PSFs complement the FoV of each other. The four different regions of the two PSFs we defined in this work are marked with white text. The colourbar shows the flux intensity after background subtraction.
Current usage metrics show cumulative count of Article Views (full-text article views including HTML views, PDF and ePub downloads, according to the available data) and Abstracts Views on Vision4Press platform.
Data correspond to usage on the plateform after 2015. The current usage metrics is available 48-96 hours after online publication and is updated daily on week days.
Initial download of the metrics may take a while.