Fig. 10
Download original image
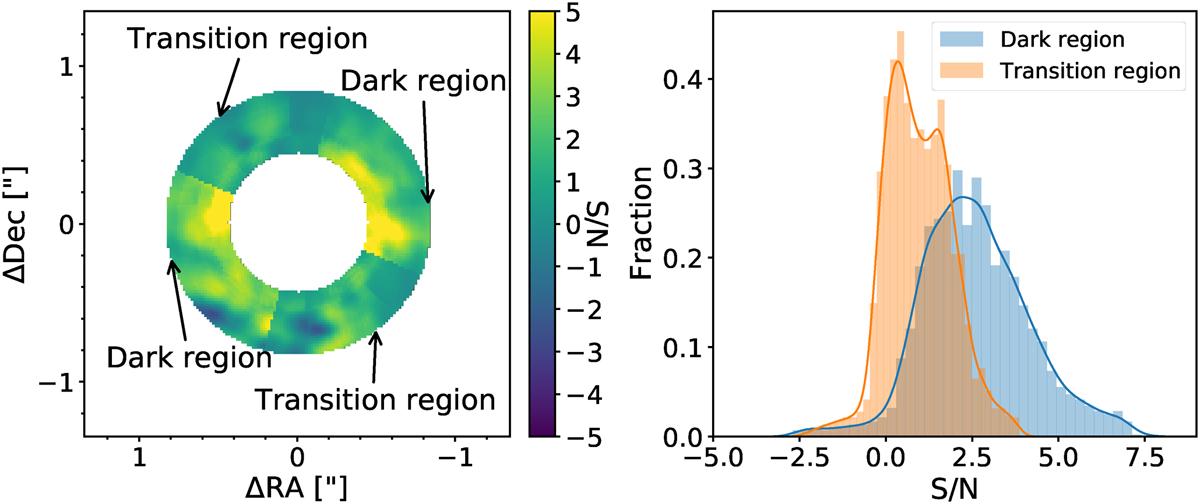
S/N retrieved with cADI of 5σ injection. The injected 5σ signal at each position comes from the TRAP 5σ map of the Altair dataset. Left panel: retrieved S/N map with cADI. The injected region is from 412 to 792 mas. The stronger detection at the inner part of the dark region is due to the higher false alarm probabilities caused by small sample statistics (Mawet et al. 2014). Only a small number of pixels are available for normalisation at small separations, and therefore the uncertainty is underestimated. Right panel: S/N histogram of the left panel. The blue line depicts the profile of the dark region with a median S/N of 2.5 and the orange line depicts of the profile of the transition region with a median S/N of 0.9.
Current usage metrics show cumulative count of Article Views (full-text article views including HTML views, PDF and ePub downloads, according to the available data) and Abstracts Views on Vision4Press platform.
Data correspond to usage on the plateform after 2015. The current usage metrics is available 48-96 hours after online publication and is updated daily on week days.
Initial download of the metrics may take a while.