Fig. 8
Download original image
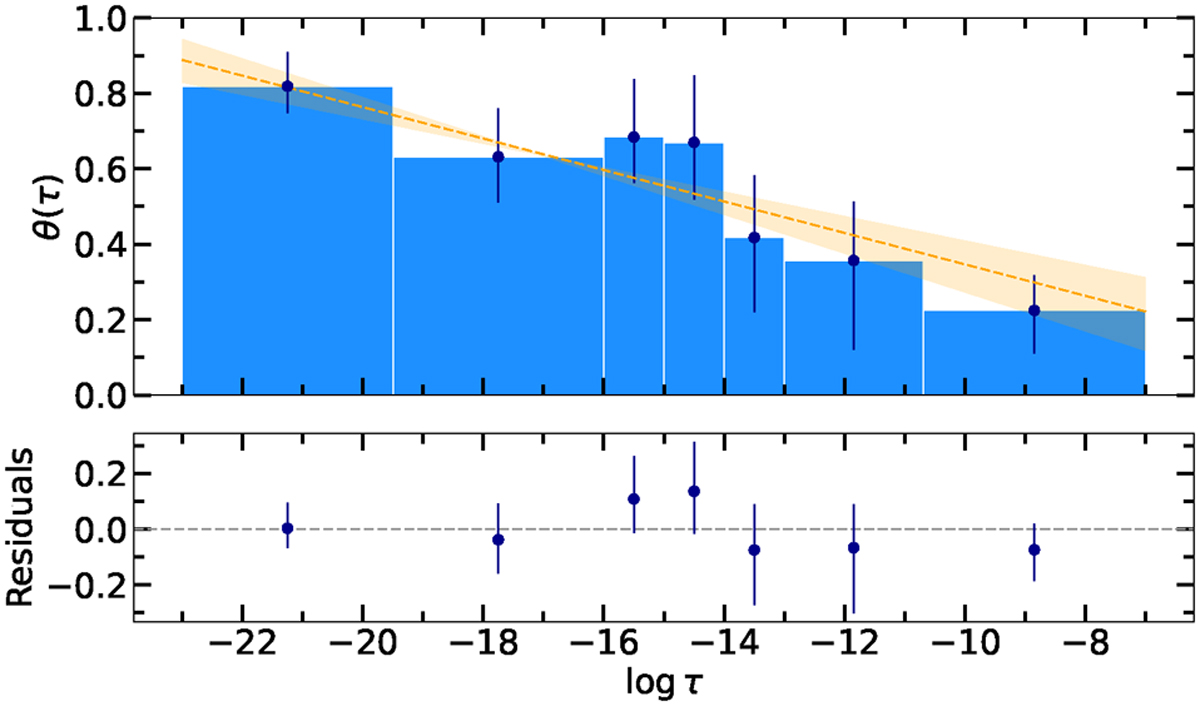
Misalignment fraction as a function of the tidal efficiency factor for all systems in our sample. Top: misalignment fraction bar plot, reported from the top of Fig. 7. The best linear fit relation (Eq. (12)) can be used as an estimator for the probability that a system lies in a misaligned configuration. Bottom: residuals between the medians of the misalignment fractions and the linear fit.
Current usage metrics show cumulative count of Article Views (full-text article views including HTML views, PDF and ePub downloads, according to the available data) and Abstracts Views on Vision4Press platform.
Data correspond to usage on the plateform after 2015. The current usage metrics is available 48-96 hours after online publication and is updated daily on week days.
Initial download of the metrics may take a while.