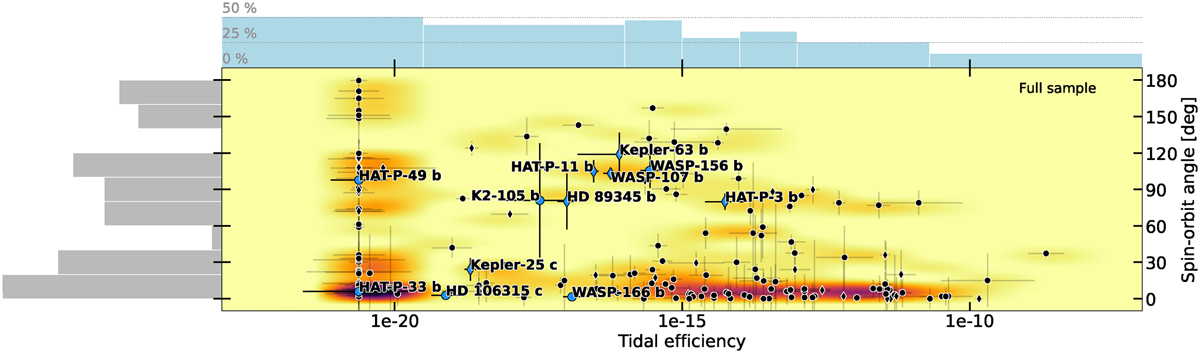
Fig. 5
Download original image
Distribution of spin–orbit angles as a function of the tidal efficiency factor τ. Same color, symbol, and histogram schemes as in Fig. 2. All systems with a zero tidal efficiency factor have been set to the minimal value of the sample. The gray histogram on the left of the plot covers only the first (lowest) tidal efficiency bin.
Current usage metrics show cumulative count of Article Views (full-text article views including HTML views, PDF and ePub downloads, according to the available data) and Abstracts Views on Vision4Press platform.
Data correspond to usage on the plateform after 2015. The current usage metrics is available 48-96 hours after online publication and is updated daily on week days.
Initial download of the metrics may take a while.