Open Access
Fig. 34.
Download original image
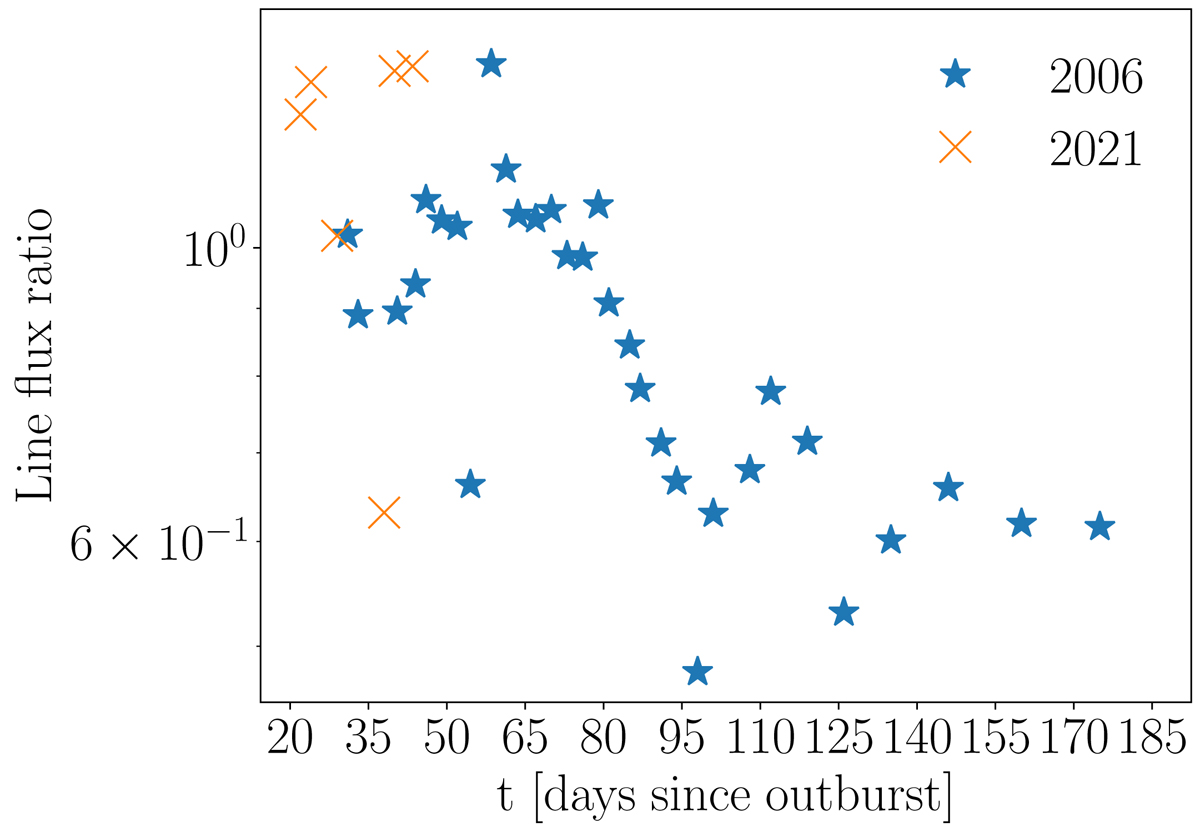
[Ne V] λ3426 Å to [Ne III] λ3869 Å flux ratio in RS Oph 2006 and 2021: temporal evolution of the ratio between integrated fluxes of the emission lines. Data are binned and averaged over intervals of 3 days.
Current usage metrics show cumulative count of Article Views (full-text article views including HTML views, PDF and ePub downloads, according to the available data) and Abstracts Views on Vision4Press platform.
Data correspond to usage on the plateform after 2015. The current usage metrics is available 48-96 hours after online publication and is updated daily on week days.
Initial download of the metrics may take a while.