Fig. 1.
Download original image
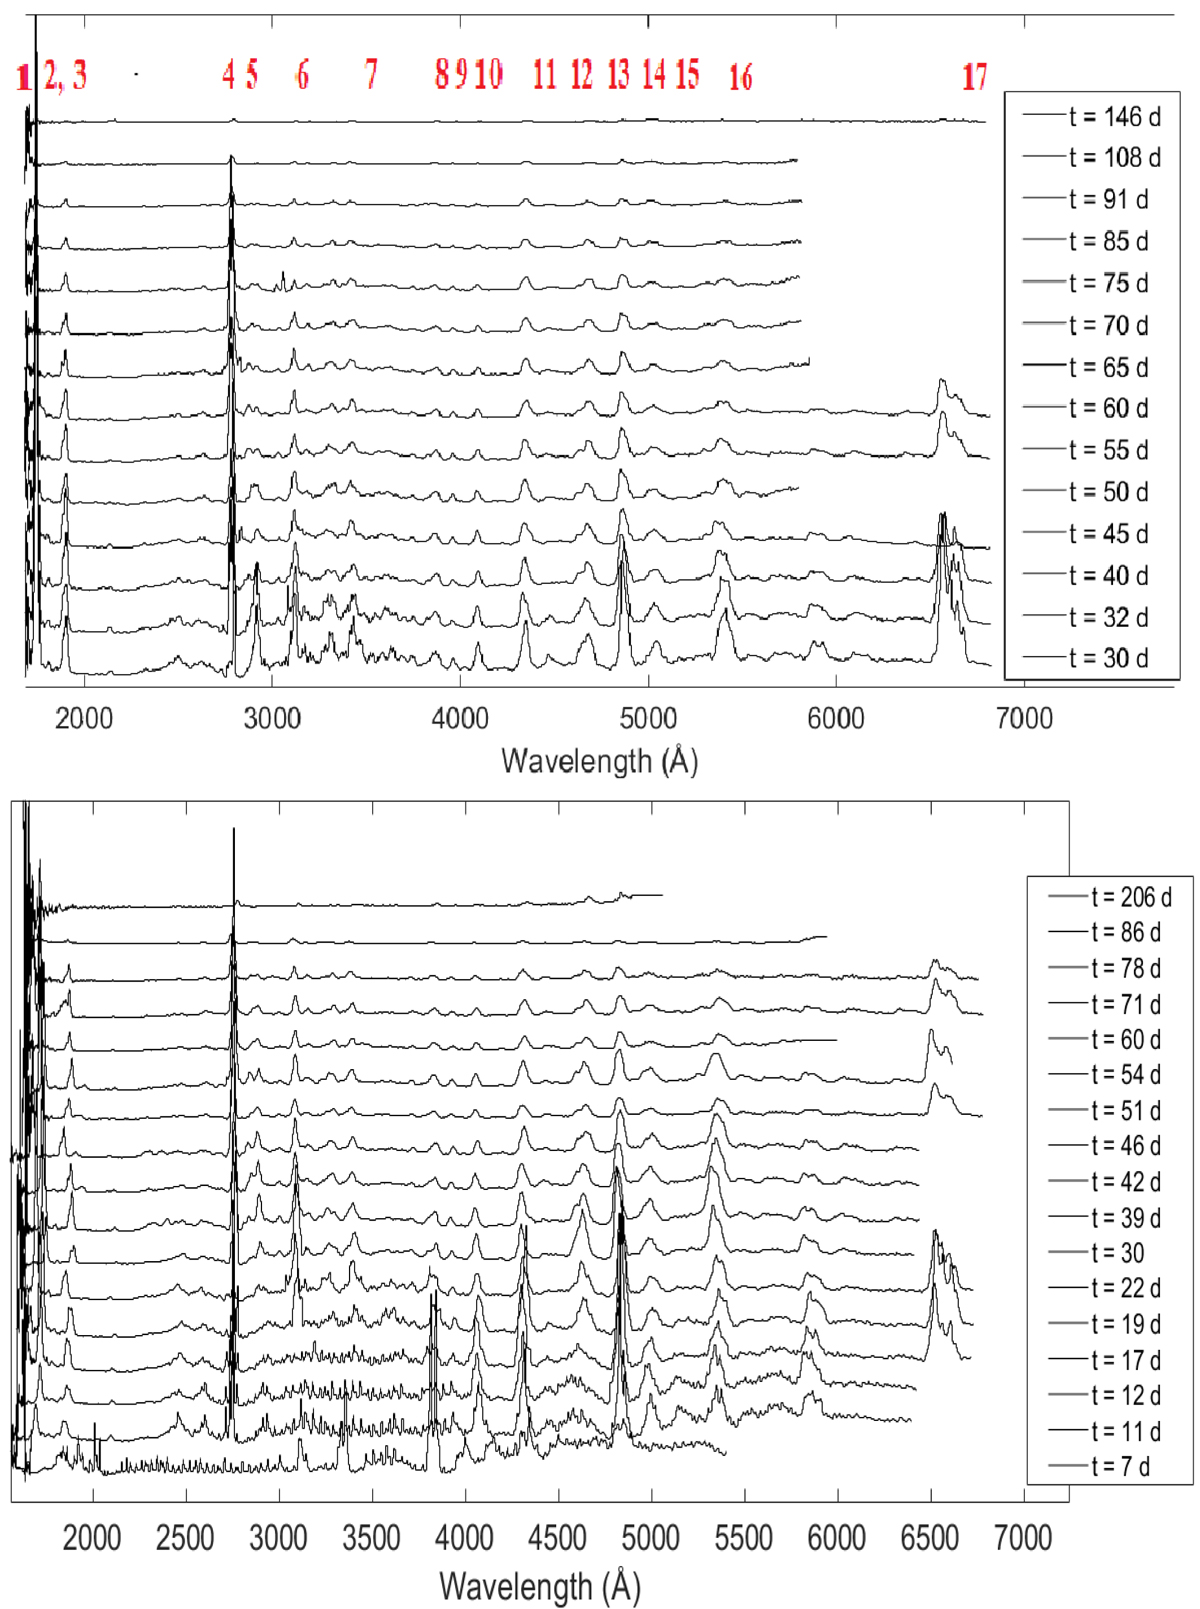
Spectral sequence of RS Ophiuchi at various stages during its 2006 (upper panel) and 2021 (lower panel) outbursts in UVOT data. The flux in units ![]() of each spectrum was normalised and then plotted with an applied offset of 2. The highlighted emission lines are listed in Table 3. In the first four 2021 spectra the area of peak sensitivity around 2900 Å was saturated.
of each spectrum was normalised and then plotted with an applied offset of 2. The highlighted emission lines are listed in Table 3. In the first four 2021 spectra the area of peak sensitivity around 2900 Å was saturated.
Current usage metrics show cumulative count of Article Views (full-text article views including HTML views, PDF and ePub downloads, according to the available data) and Abstracts Views on Vision4Press platform.
Data correspond to usage on the plateform after 2015. The current usage metrics is available 48-96 hours after online publication and is updated daily on week days.
Initial download of the metrics may take a while.