Open Access
Fig. 13.
Download original image
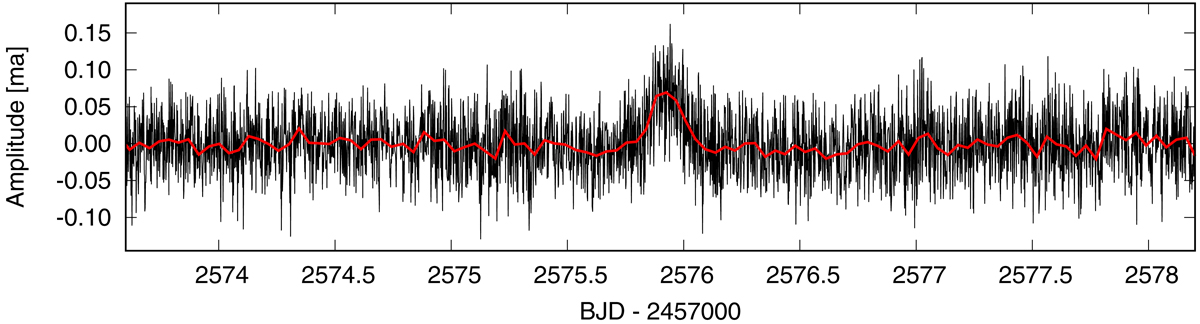
WD J0925+0509: Portion of the light curve obtained by TESS during the sector 46 120-s cadence mode observations (black line). The red line shows this light curve as binned, with a bin size of 30 points. The maximum of the flux emergence is about 7 per cent, and the phenomenon takes about 0.5 day.
Current usage metrics show cumulative count of Article Views (full-text article views including HTML views, PDF and ePub downloads, according to the available data) and Abstracts Views on Vision4Press platform.
Data correspond to usage on the plateform after 2015. The current usage metrics is available 48-96 hours after online publication and is updated daily on week days.
Initial download of the metrics may take a while.