Open Access
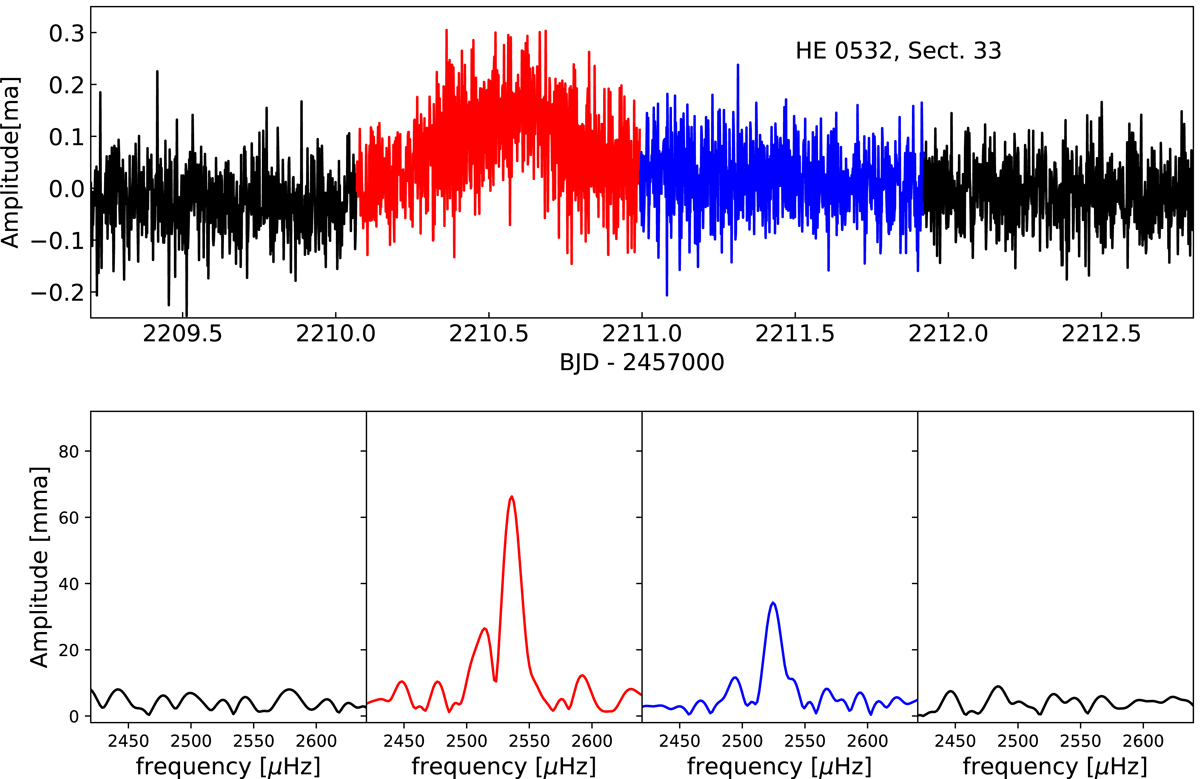
Fig. 10.
Download original image
HE 0532-5605: Top: 120 s observations surrounding the outburst during sector 33. Colours correspond to 80 000 second segments of the light curves for which the Fourier transforms are shown in the lower panels.
Current usage metrics show cumulative count of Article Views (full-text article views including HTML views, PDF and ePub downloads, according to the available data) and Abstracts Views on Vision4Press platform.
Data correspond to usage on the plateform after 2015. The current usage metrics is available 48-96 hours after online publication and is updated daily on week days.
Initial download of the metrics may take a while.