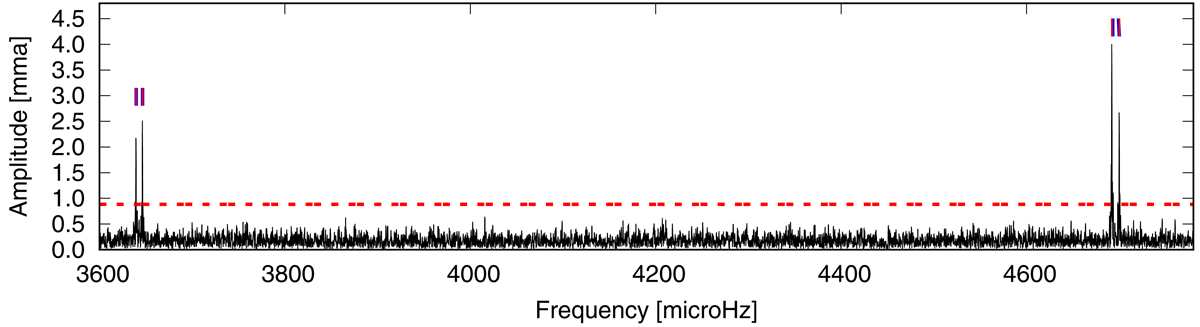
Fig. 1.
Download original image
Ross 548: Fourier transform of the ultrashort cadence mode light curve. We mark the frequencies detected in the previous TESS season with blue lines, while red lines denote the newly found frequencies, and the red dashed line corresponds to the 0.1% FAP significance level. We note that in this case the blue and red lines marking the individual frequencies align, because we successfully detect the previously known frequencies.
Current usage metrics show cumulative count of Article Views (full-text article views including HTML views, PDF and ePub downloads, according to the available data) and Abstracts Views on Vision4Press platform.
Data correspond to usage on the plateform after 2015. The current usage metrics is available 48-96 hours after online publication and is updated daily on week days.
Initial download of the metrics may take a while.