Fig. B.1
Download original image
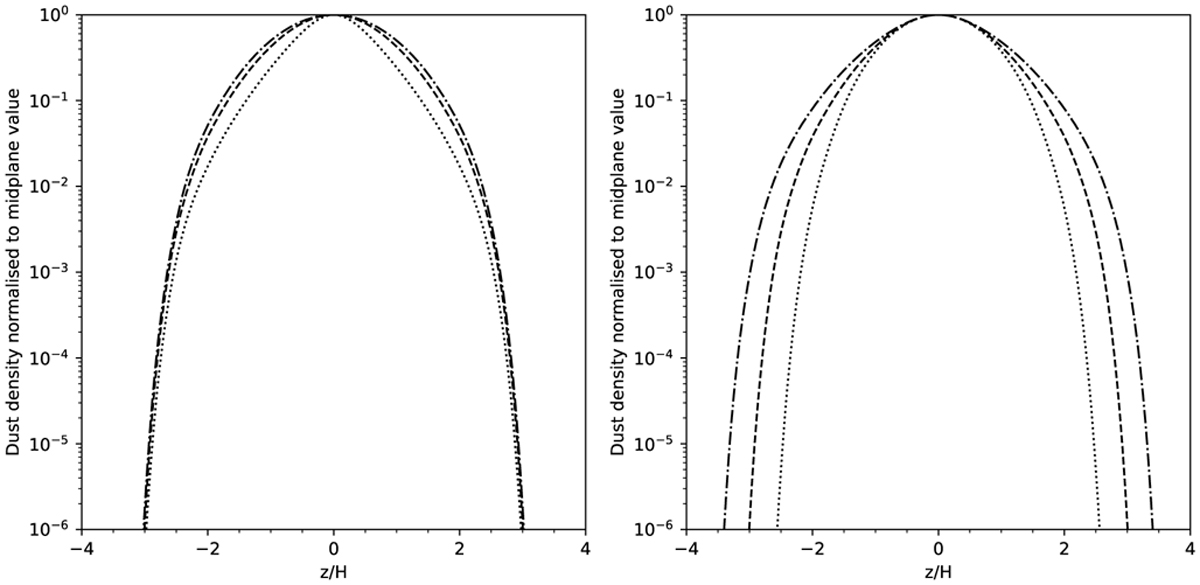
Diagnostic plot to test the vertical grain distribution (same as figure 13 in Fromang et al. 2007). Left: Variation of the midplane velocity fluctuations. Dotted: δυz,mid/cs = 0.025, dashed: δυz,mid/cs = 0.05, dash-dotted: δυz,mid/cs = 0.075. Right: Variation of the upper layer velocity fluctuations. Dotted: δυz,up/cs = 0.075, dashed: δυz,up/cs = 0.15, dash-dotted: δυz,up/cs = 0.3.
Current usage metrics show cumulative count of Article Views (full-text article views including HTML views, PDF and ePub downloads, according to the available data) and Abstracts Views on Vision4Press platform.
Data correspond to usage on the plateform after 2015. The current usage metrics is available 48-96 hours after online publication and is updated daily on week days.
Initial download of the metrics may take a while.