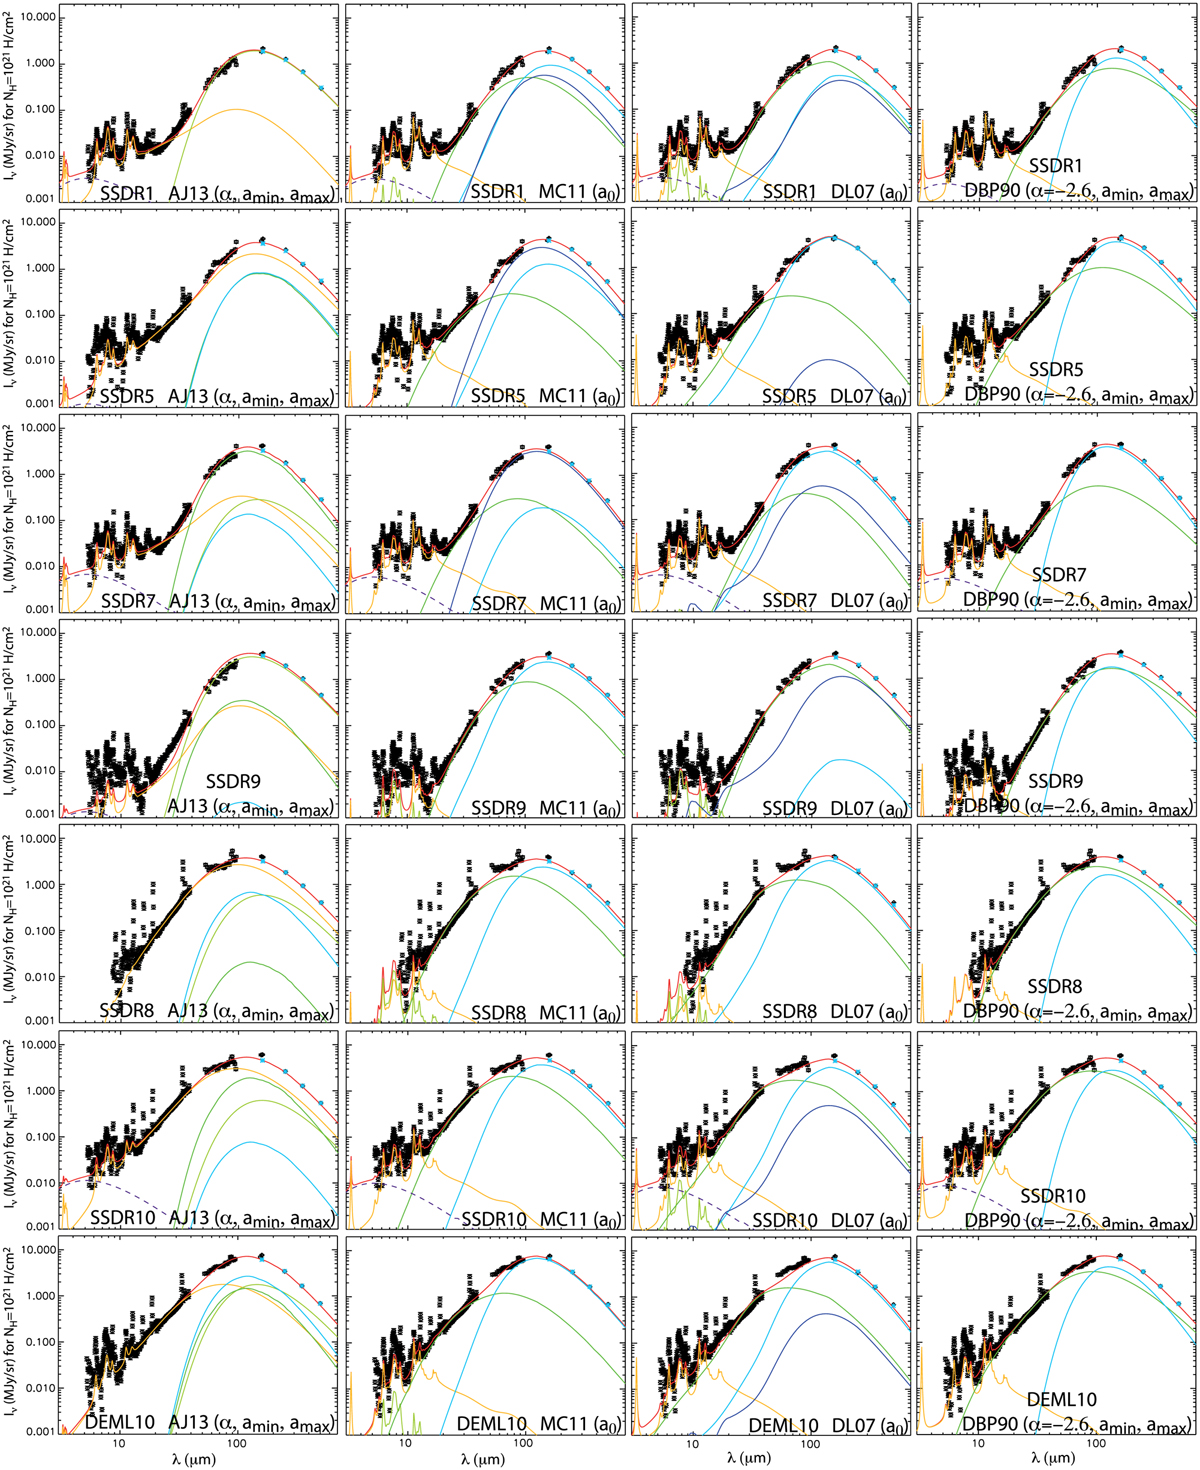
Fig. A.1
Download original image
Modeling of the SEDs of the ten regions with different dust models and free parameters (XISRF, dust abundances, and small-grain dust size distribution) using the 4 Myr RF. The observations are shown in black (Spitzer IRS SS and LL, MIPS SED, MIPS 160 μm, Berschel Photometric PACS 160 mic, and SPIRE 250 μm, 350 μm, and 500 μm data). The total modeled SED is shown as a red line. The other colored lines correspond to the different dust components of the models (see Fig. 1 or 2). The dashed line represents the additional NIR continuum. Blue asterisks show the color-corrected brightness derived from the models. Each column shows the fit using different dust models (from left to right: AJ13, MC11, DL07, and DBP90). Each row presents a different region. The figure continues on the next page.
Current usage metrics show cumulative count of Article Views (full-text article views including HTML views, PDF and ePub downloads, according to the available data) and Abstracts Views on Vision4Press platform.
Data correspond to usage on the plateform after 2015. The current usage metrics is available 48-96 hours after online publication and is updated daily on week days.
Initial download of the metrics may take a while.