Open Access
Fig. 6
Download original image
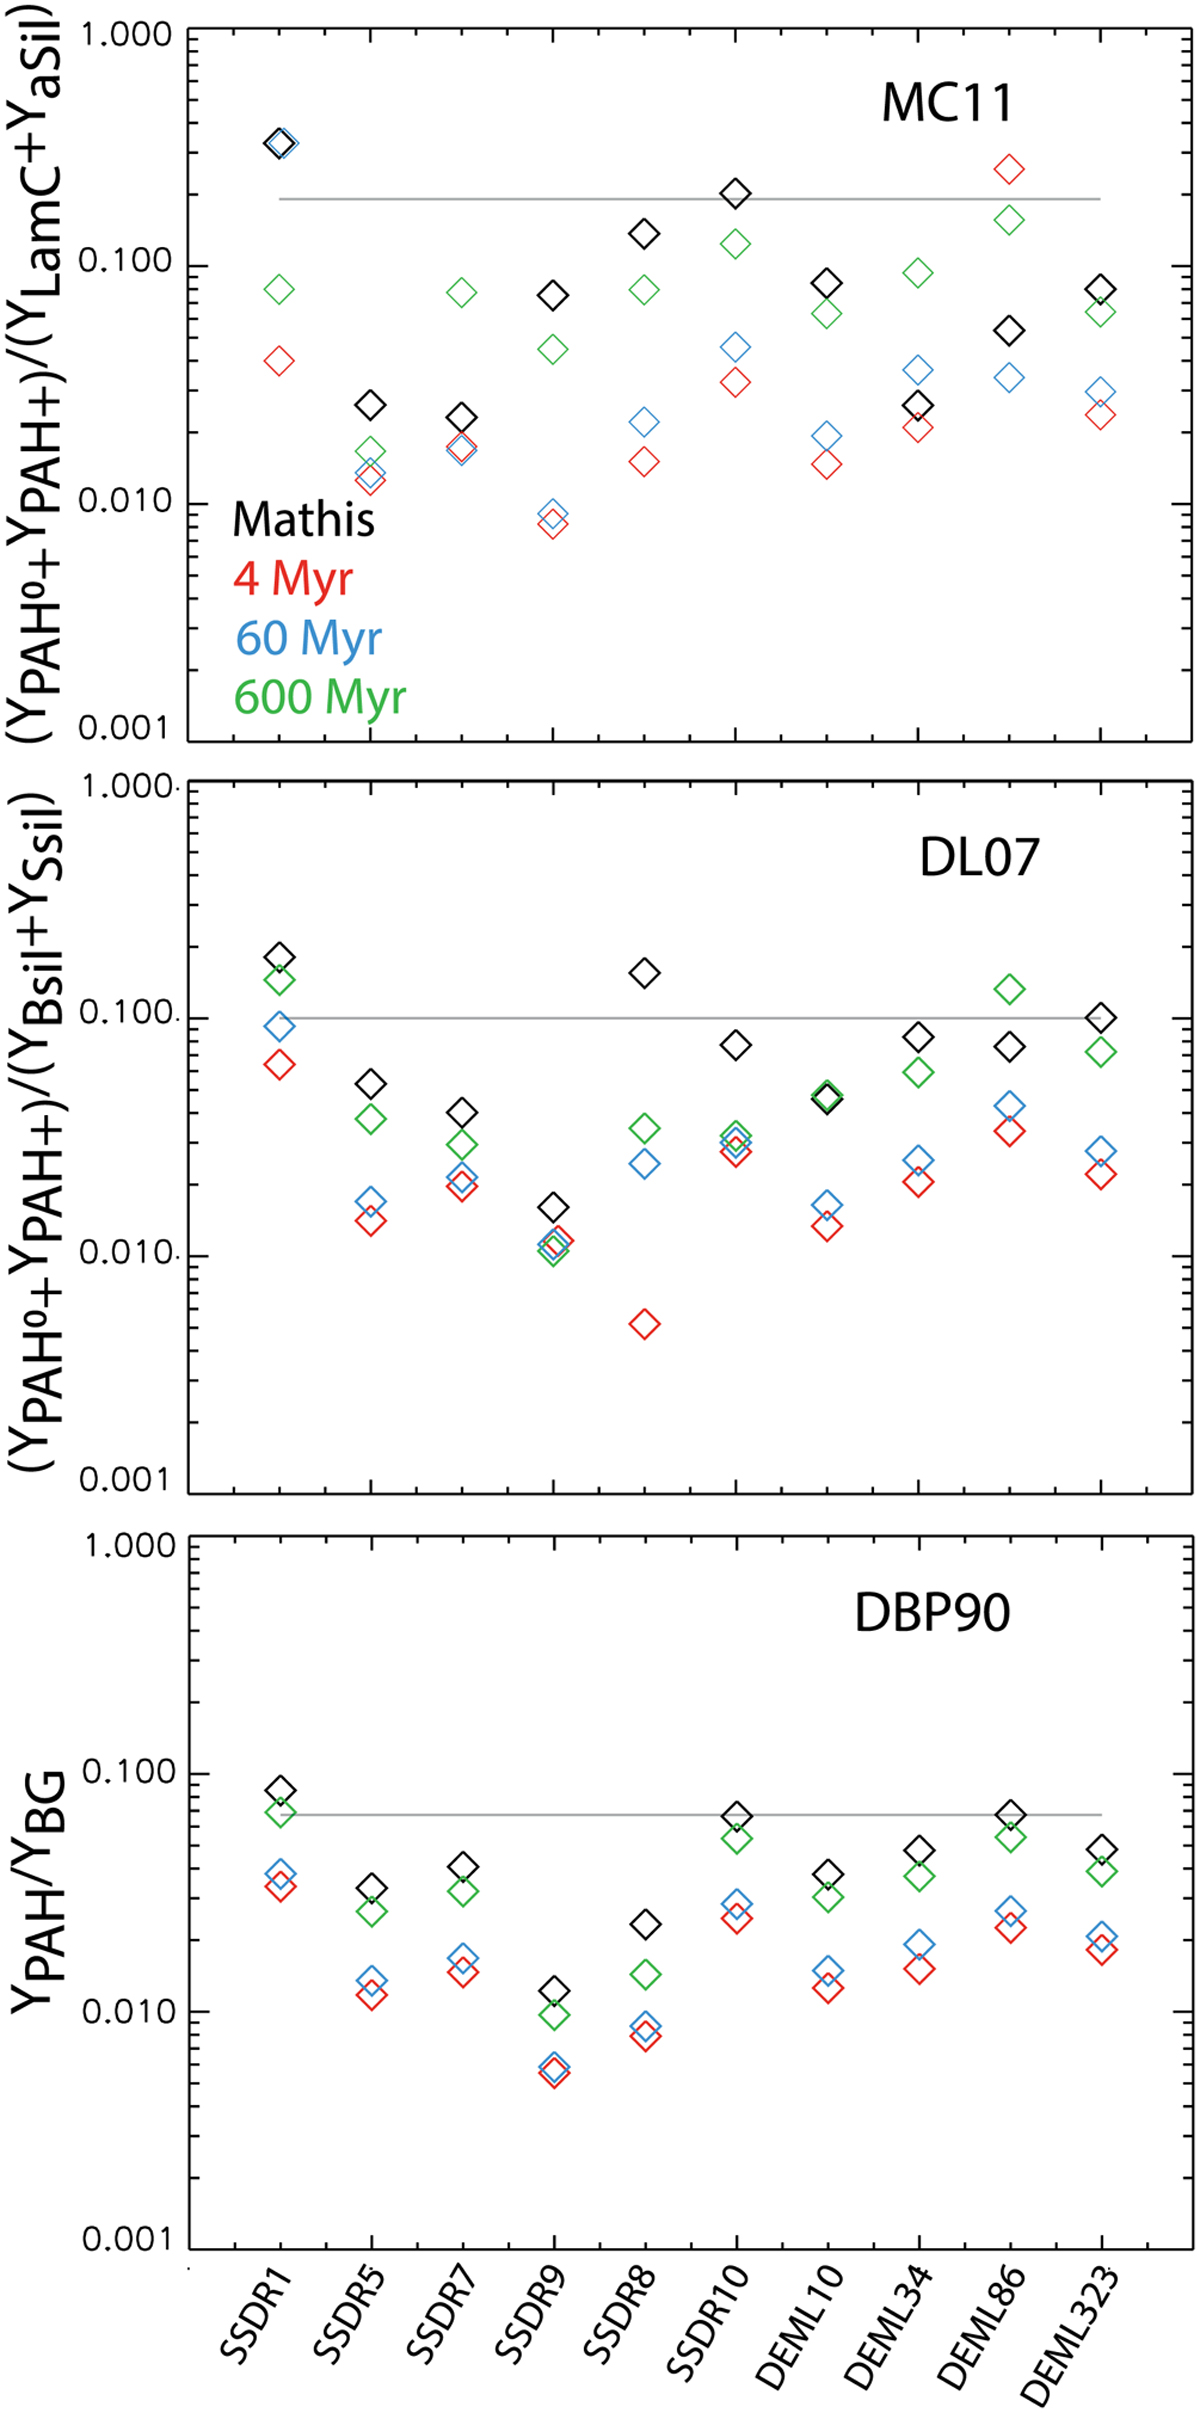
Ratio of the PAHs to the large-grain component abundance for the different models and for the ten regions using different RFs (Mathis in black, 4 Myr in red, 60 Myr in blue, and 600 Myr in green). The Galactic value is indicated with the gray line.
Current usage metrics show cumulative count of Article Views (full-text article views including HTML views, PDF and ePub downloads, according to the available data) and Abstracts Views on Vision4Press platform.
Data correspond to usage on the plateform after 2015. The current usage metrics is available 48-96 hours after online publication and is updated daily on week days.
Initial download of the metrics may take a while.