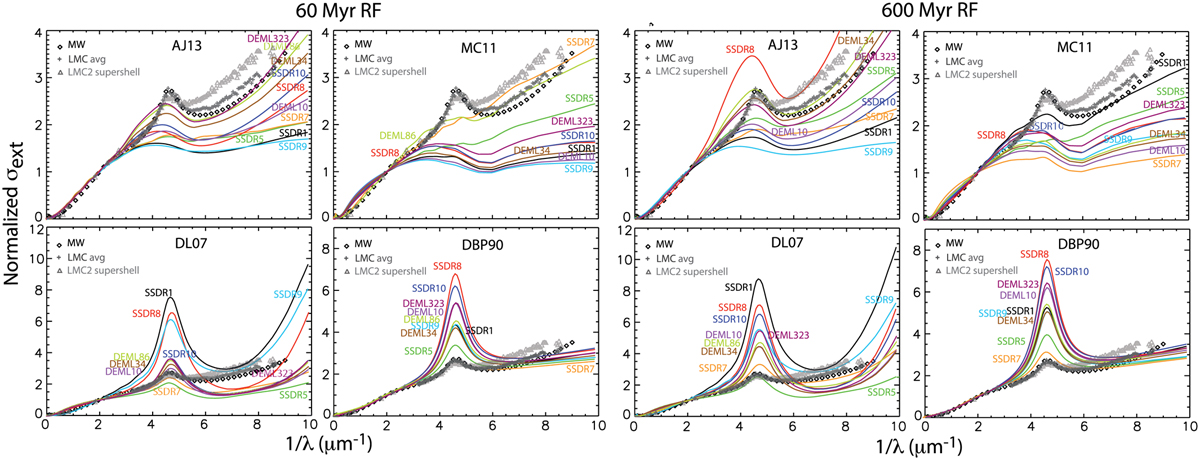
Fig. A.4
Download original image
Extinction curves for each region derived from the different dust models with a 60 Myr RF (left) and 600 Myr (right). The averaged Galactic and LMC extinction curves are plotted as black diamonds and dark gray crosses for comparison. The LMC2 supershell extinction curve is presented with light gray triangles. We caution that the scales have been chosen to show the difference between the different models in a clear way, and this must be taken into account in the comparisons.
Current usage metrics show cumulative count of Article Views (full-text article views including HTML views, PDF and ePub downloads, according to the available data) and Abstracts Views on Vision4Press platform.
Data correspond to usage on the plateform after 2015. The current usage metrics is available 48-96 hours after online publication and is updated daily on week days.
Initial download of the metrics may take a while.