Fig. 6
Download original image
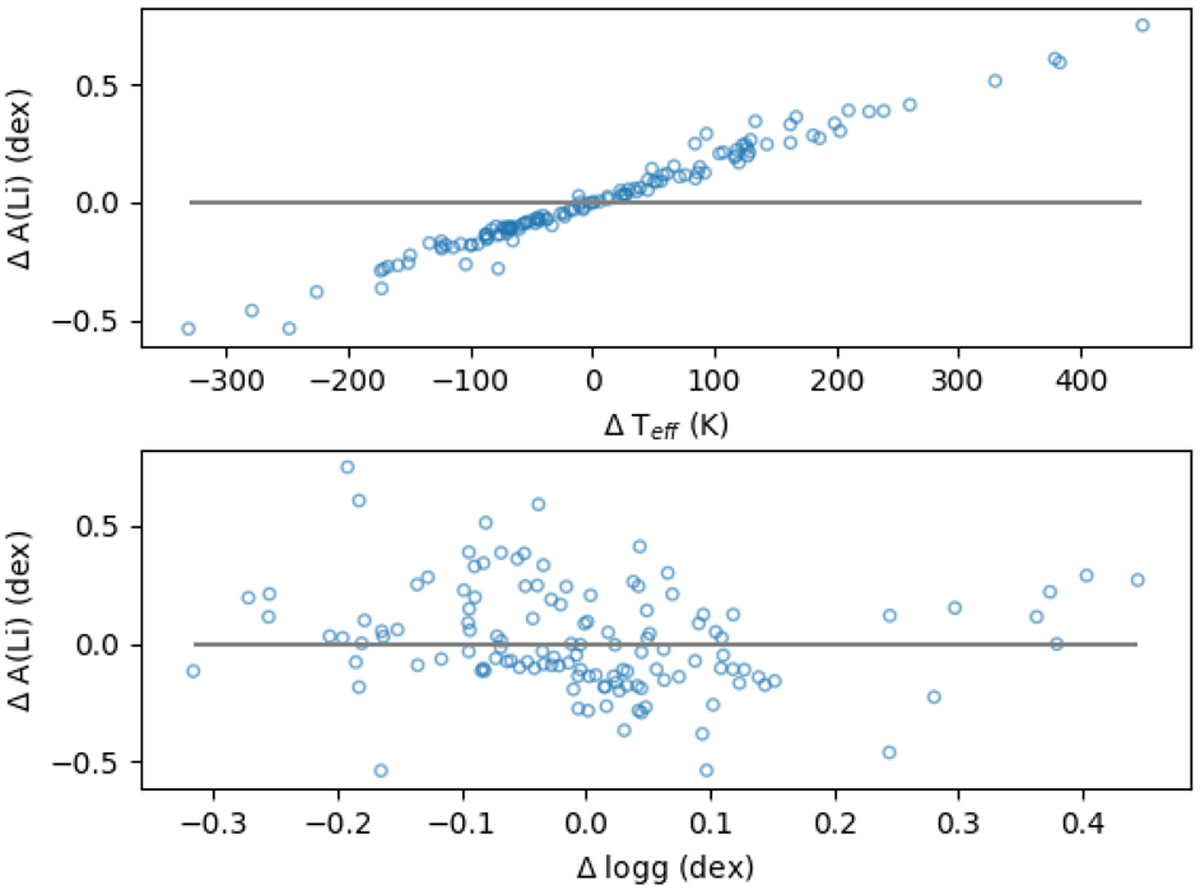
Impact of stellar parameters on the determination of Li abundance. The y-axis in both plots is the difference in Li abundance derived from spectroscopic Teff and log ɡ and from photometric Tphoto,eff and trigonometric log ɡ. Top plot: difference of Li abundance as a function of the difference in Teff between spectroscopy and photometry. Bottom plot: difference of Li abundance as a function of the difference in Teff between spectroscopy and trigonometric log ɡ.
Current usage metrics show cumulative count of Article Views (full-text article views including HTML views, PDF and ePub downloads, according to the available data) and Abstracts Views on Vision4Press platform.
Data correspond to usage on the plateform after 2015. The current usage metrics is available 48-96 hours after online publication and is updated daily on week days.
Initial download of the metrics may take a while.