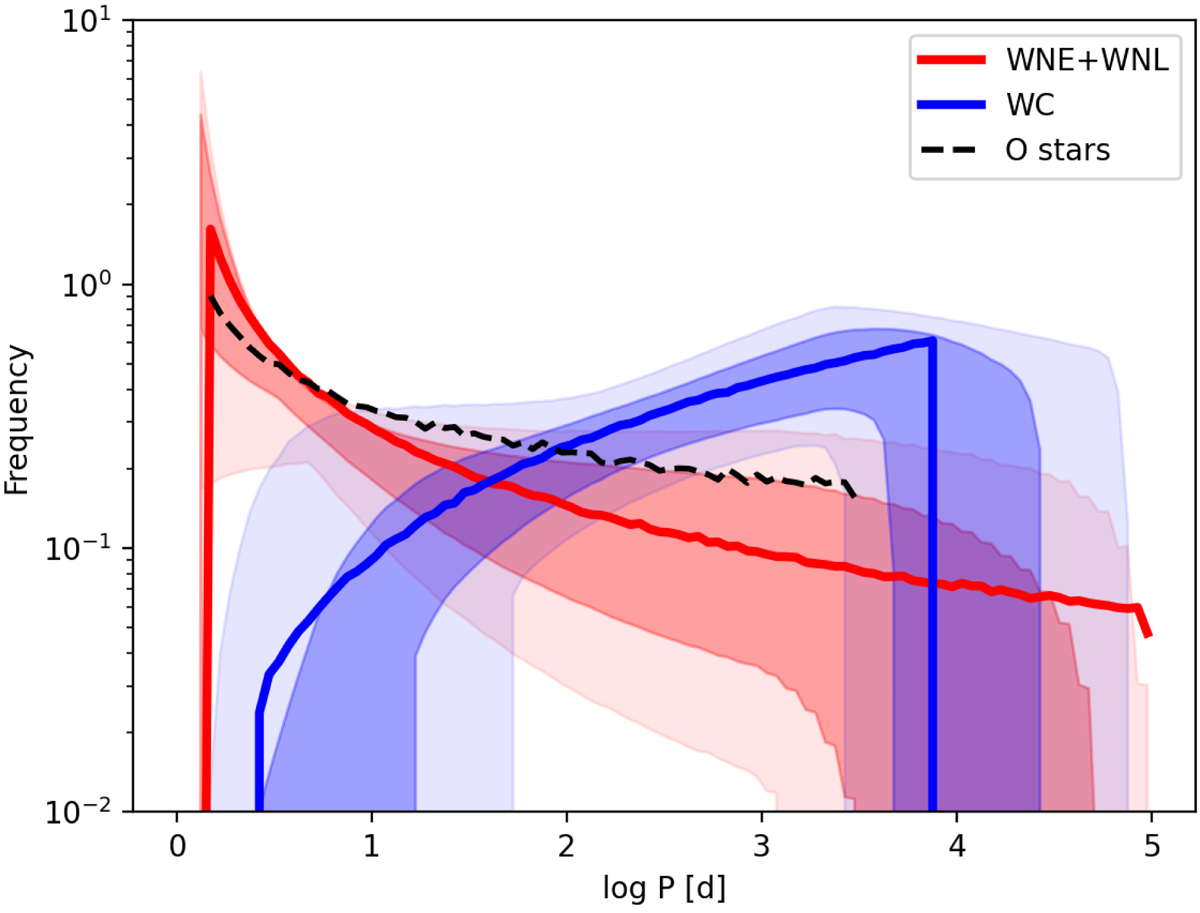
Fig. 6.
Download original image
Visualisation of the 107 period distributions created by sampling the posteriors from Fig. 5. The light and dark red regions depict 95% and 68% of all distributions. The solid red line is the distribution created with the best-fit values from the posteriors. The blue regions and lines are the same for the WC population from Paper II. The dashed black line is the period distribution for O stars from Sana et al. (2012).
Current usage metrics show cumulative count of Article Views (full-text article views including HTML views, PDF and ePub downloads, according to the available data) and Abstracts Views on Vision4Press platform.
Data correspond to usage on the plateform after 2015. The current usage metrics is available 48-96 hours after online publication and is updated daily on week days.
Initial download of the metrics may take a while.