Fig. 8.
Download original image
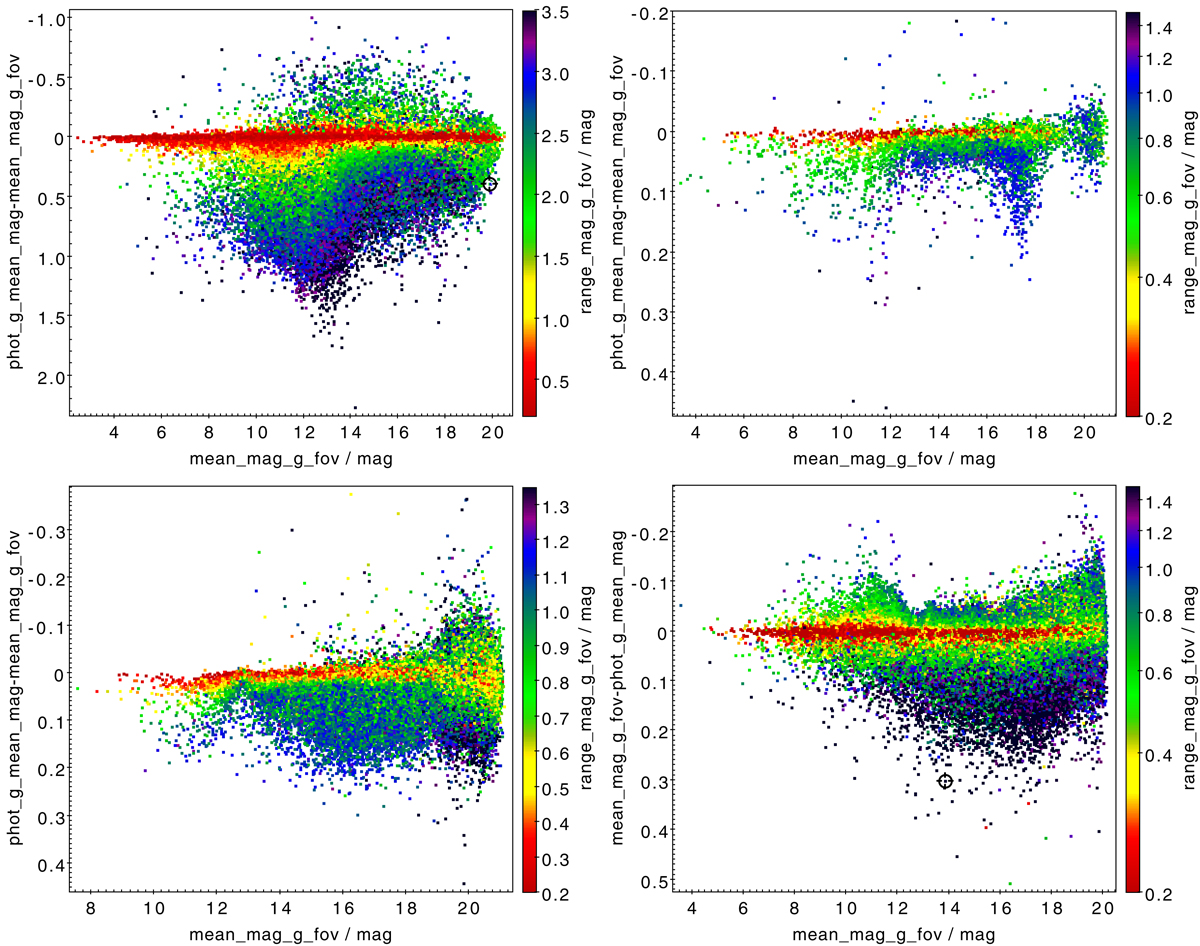
Diagrams of the differences between two estimators of the mean found in the Gaia archive (mean_mag_g_fov in the vari_summary table and phot_g_mean_mag in the gaia_source table). The weighted mean on fluxes versus the unweighted mean on FoV magnitudes. The colour scale is the range of the magnitude distribution, and is therefore given as a function of the signal amplitude. Top left panel: Long-period variables. Top right: Cepheids. Bottom left: RR Lyrae stars. Bottom right: Eclipsing binaries.
Current usage metrics show cumulative count of Article Views (full-text article views including HTML views, PDF and ePub downloads, according to the available data) and Abstracts Views on Vision4Press platform.
Data correspond to usage on the plateform after 2015. The current usage metrics is available 48-96 hours after online publication and is updated daily on week days.
Initial download of the metrics may take a while.