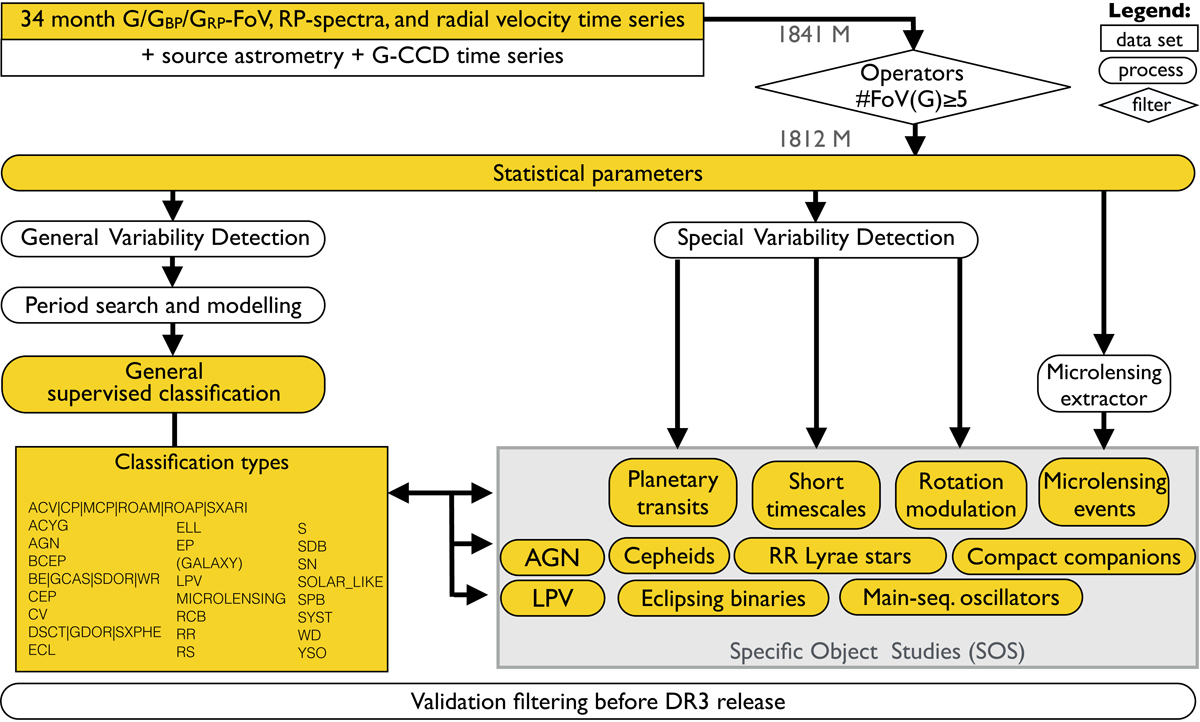
Fig. 3.
Download original image
Overview of the DR3 variability analysis pipeline. The steps are data cleaning (operators) and statistical parameter calculations. The pipeline then splits into two parts: the general variability detection and the special variability detection. A supervised classification is applied with 24 variability types. Tailored analyses are done for 11 specific variability types, and are called specific object studies (SOS) packages.
Current usage metrics show cumulative count of Article Views (full-text article views including HTML views, PDF and ePub downloads, according to the available data) and Abstracts Views on Vision4Press platform.
Data correspond to usage on the plateform after 2015. The current usage metrics is available 48-96 hours after online publication and is updated daily on week days.
Initial download of the metrics may take a while.