Fig. 1.
Download original image
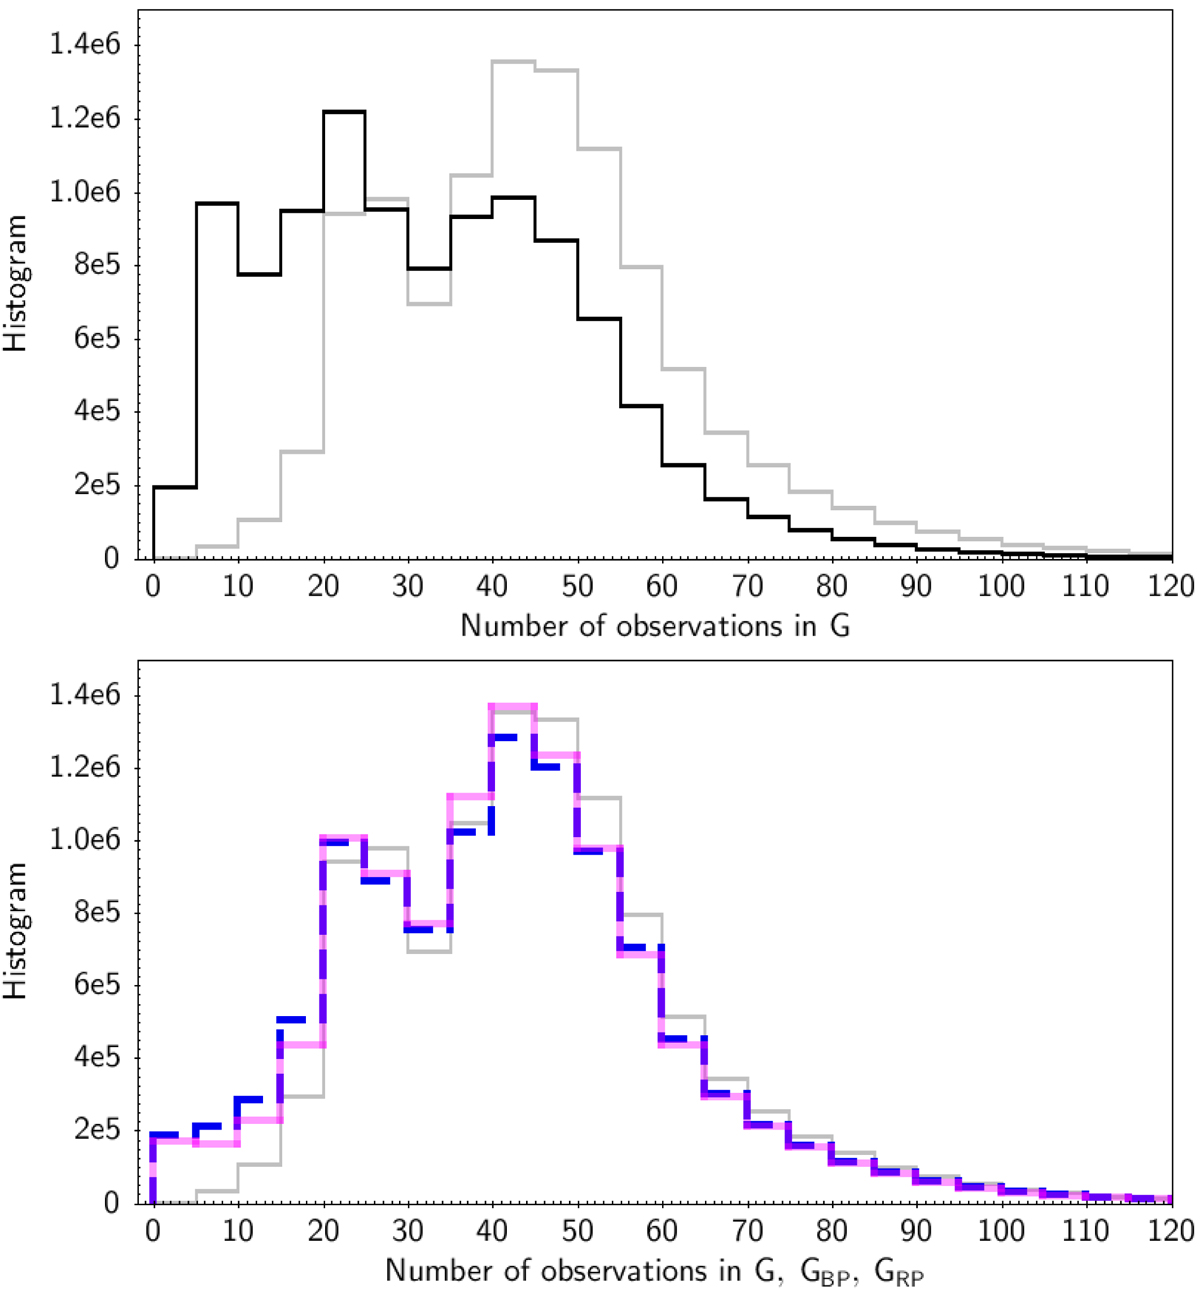
Histogram of DR3 photometric FoV observations. Top panel: Histogram of measurement numbers for the G band of a random sample of 10.5 million stars (black line); the grey line shows the same but for the 10.5 variable sources only. We see that the variability analysis favours a high number of measurements, as expected. The abscissa is truncated to 120, though the distributions have long tails up to 265. Lower panel: Histogram of DR3 photometric FoV observations restricted to the 10.5 million variable sources in the G (grey), GBP (blue, dashed line), and GRP (red) bands. The median numbers of measurements of G, BP, and RP are 44, 40, and 41.
Current usage metrics show cumulative count of Article Views (full-text article views including HTML views, PDF and ePub downloads, according to the available data) and Abstracts Views on Vision4Press platform.
Data correspond to usage on the plateform after 2015. The current usage metrics is available 48-96 hours after online publication and is updated daily on week days.
Initial download of the metrics may take a while.