Fig. 8.

Download original image
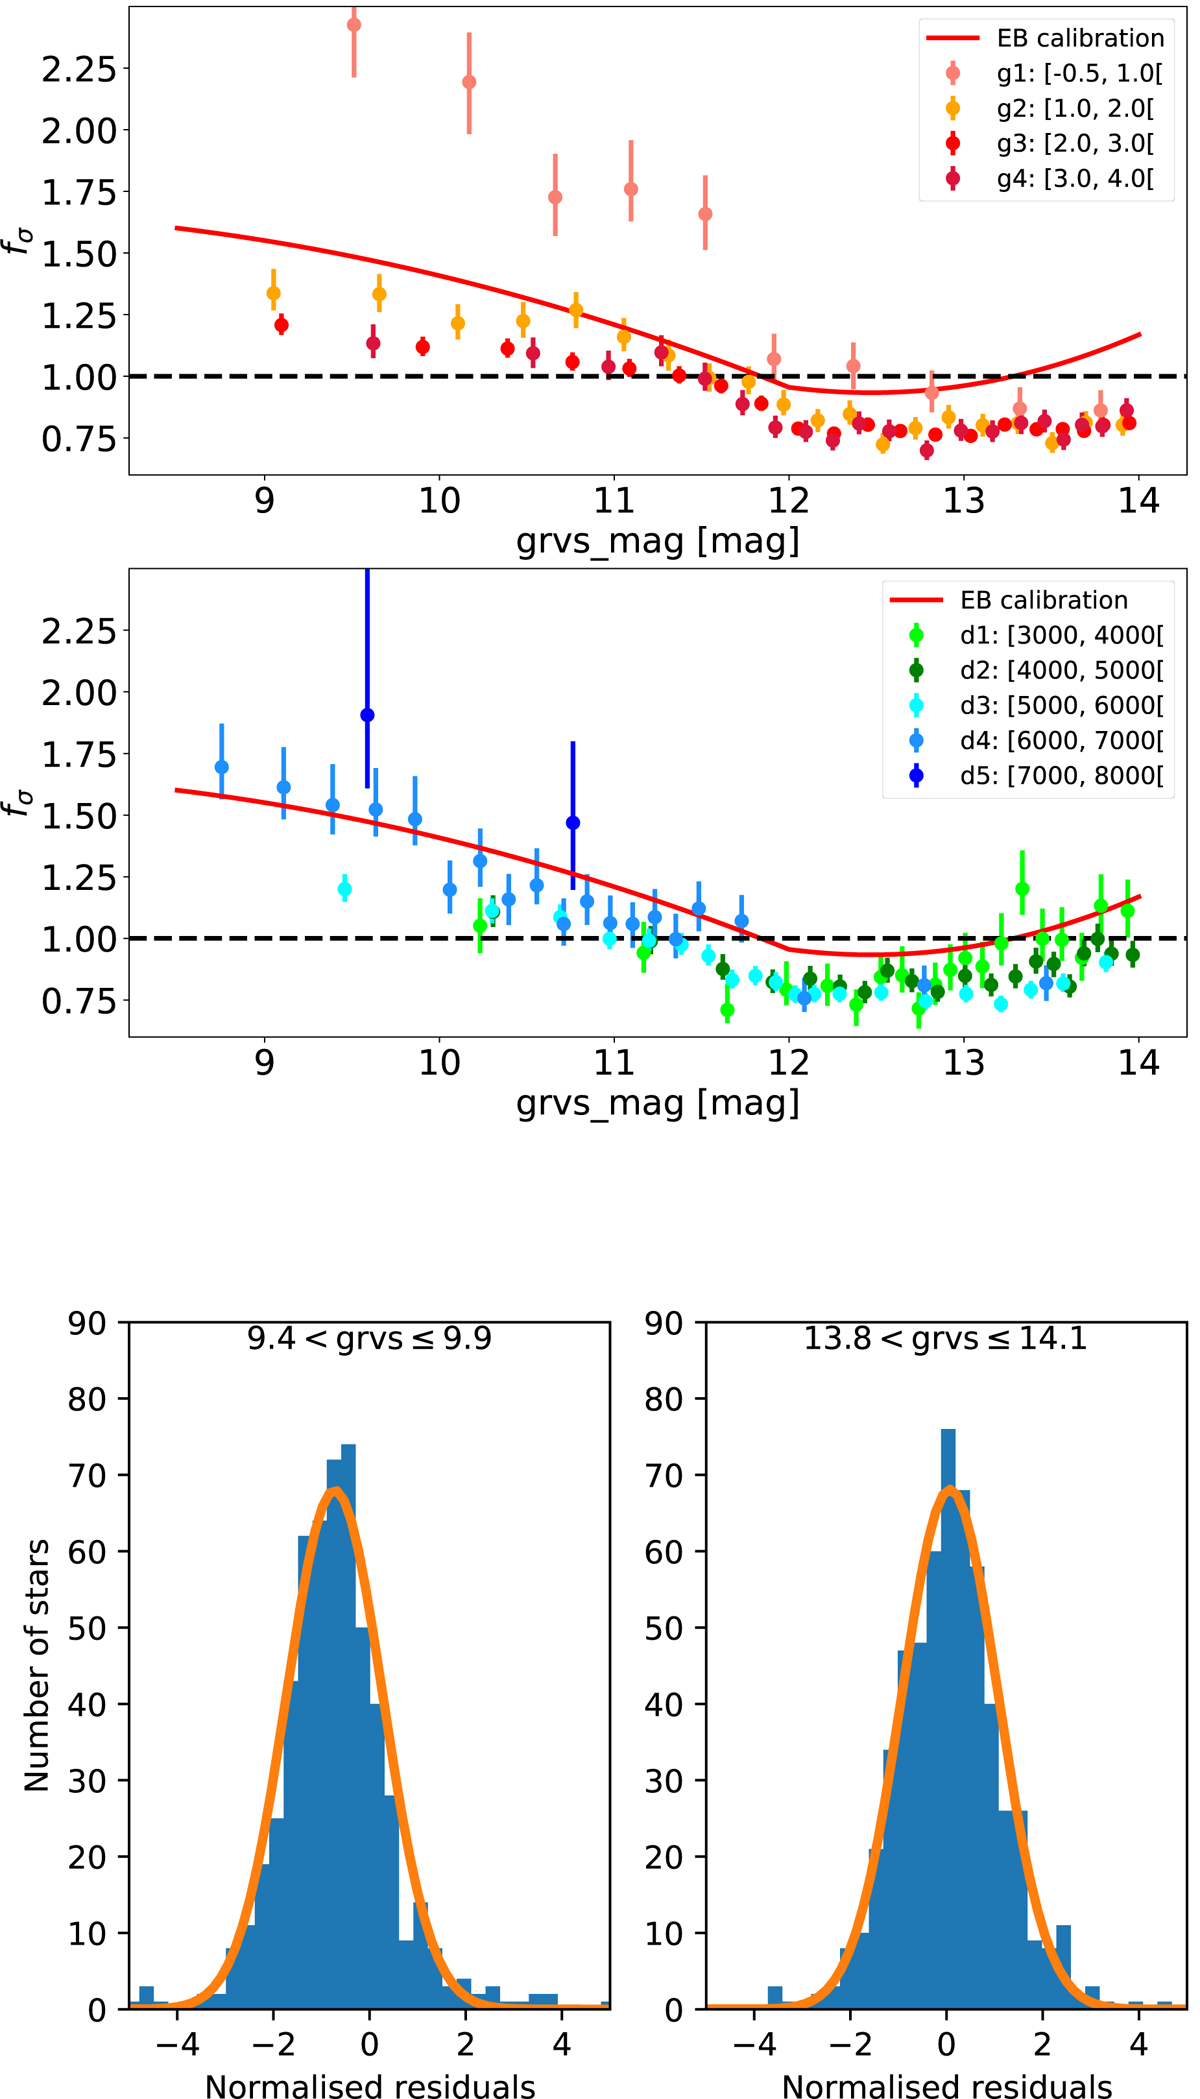
From top to bottom, row 1: standard error factor (see text) as a function of grvs_mag magnitude for the giant star samples. The range of surface gravity of each sample is provided in the legend. The red curve corresponds to the calibration of fσ provided in Babusiaux et al. (2023). Row 2: same as row 1 for the dwarf star samples. The range of effective temperature of each sample is provided in the legend. Row 3: distributions of the normalised residuals of two groups of stars from the g2 giant sample (see Appendix E), selected in the magnitude ranges grvs_mag ∈ [9.4, 9.9] (left) and [13.8, 14.1] mag (right). Gaussian profiles with standard deviations equal to 1 are overlaid (orange curves).
Current usage metrics show cumulative count of Article Views (full-text article views including HTML views, PDF and ePub downloads, according to the available data) and Abstracts Views on Vision4Press platform.
Data correspond to usage on the plateform after 2015. The current usage metrics is available 48-96 hours after online publication and is updated daily on week days.
Initial download of the metrics may take a while.


