Fig. 6.

Download original image
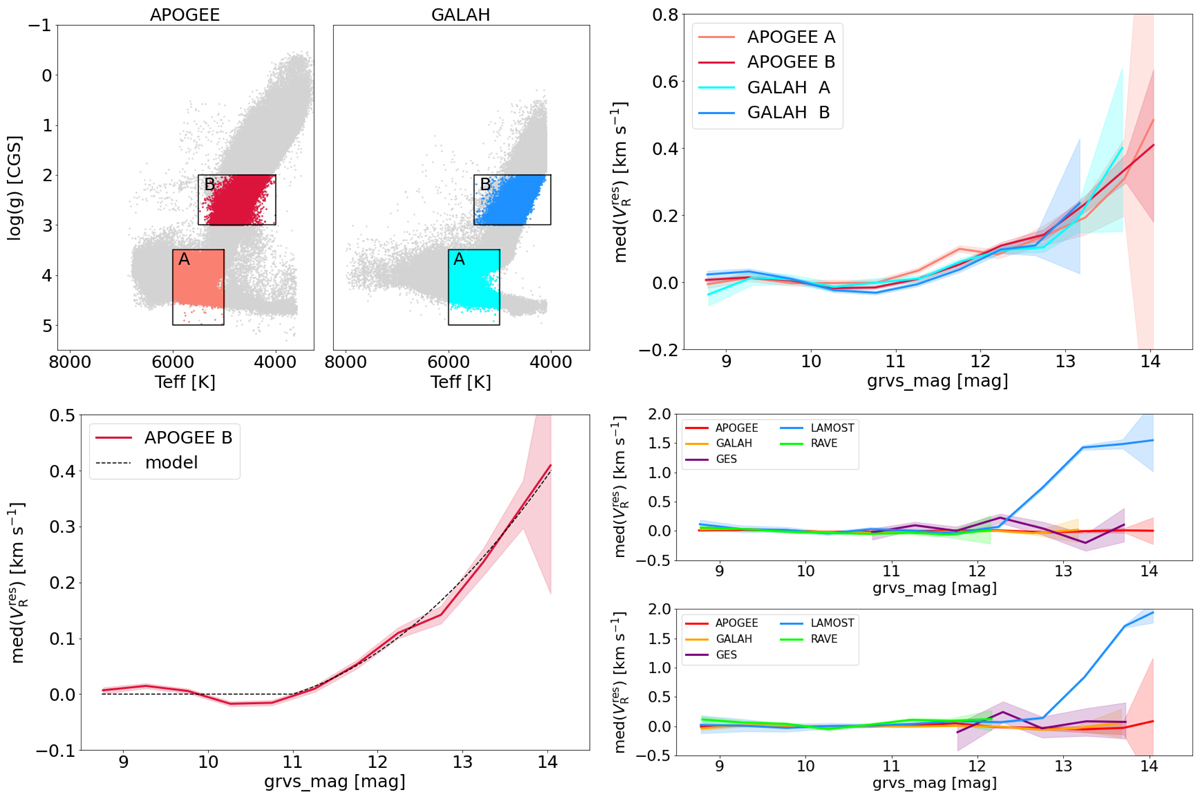
Top left: Kiel diagrams of the APOGEE and GALAH catalogues. The groups of stars selected to assess the magnitude trend are shown in salmon and cyan (group A: dwarfs and turn-off stars) and red and blue (group B: giants). Top right: median residuals of the radial velocity (Gaia minus catalogue) as a function of grvs_mag magnitude for the four samples. Bottom left: radial velocity correction model (dashed line) over-plotted on the median residuals of the radial velocity of the APOGEE B sample (red curve). Bottom right: median residuals of the radial velocity as a function of grvs_mag magnitude after applying the radial velocity correction, with respect to the five reference catalogues APOGEE, GALAH, GES, LAMOST, and RAVE. The upper panel shows group B stars (giants), and the lower panel presents group A stars (dwarfs and turn-off stars). All curves are shifted vertically (see text) and therefore show relative trends. The 68.3% confidence interval on the measurements of the medians is represented as shaded areas.
Current usage metrics show cumulative count of Article Views (full-text article views including HTML views, PDF and ePub downloads, according to the available data) and Abstracts Views on Vision4Press platform.
Data correspond to usage on the plateform after 2015. The current usage metrics is available 48-96 hours after online publication and is updated daily on week days.
Initial download of the metrics may take a while.


