Fig. 4.

Download original image
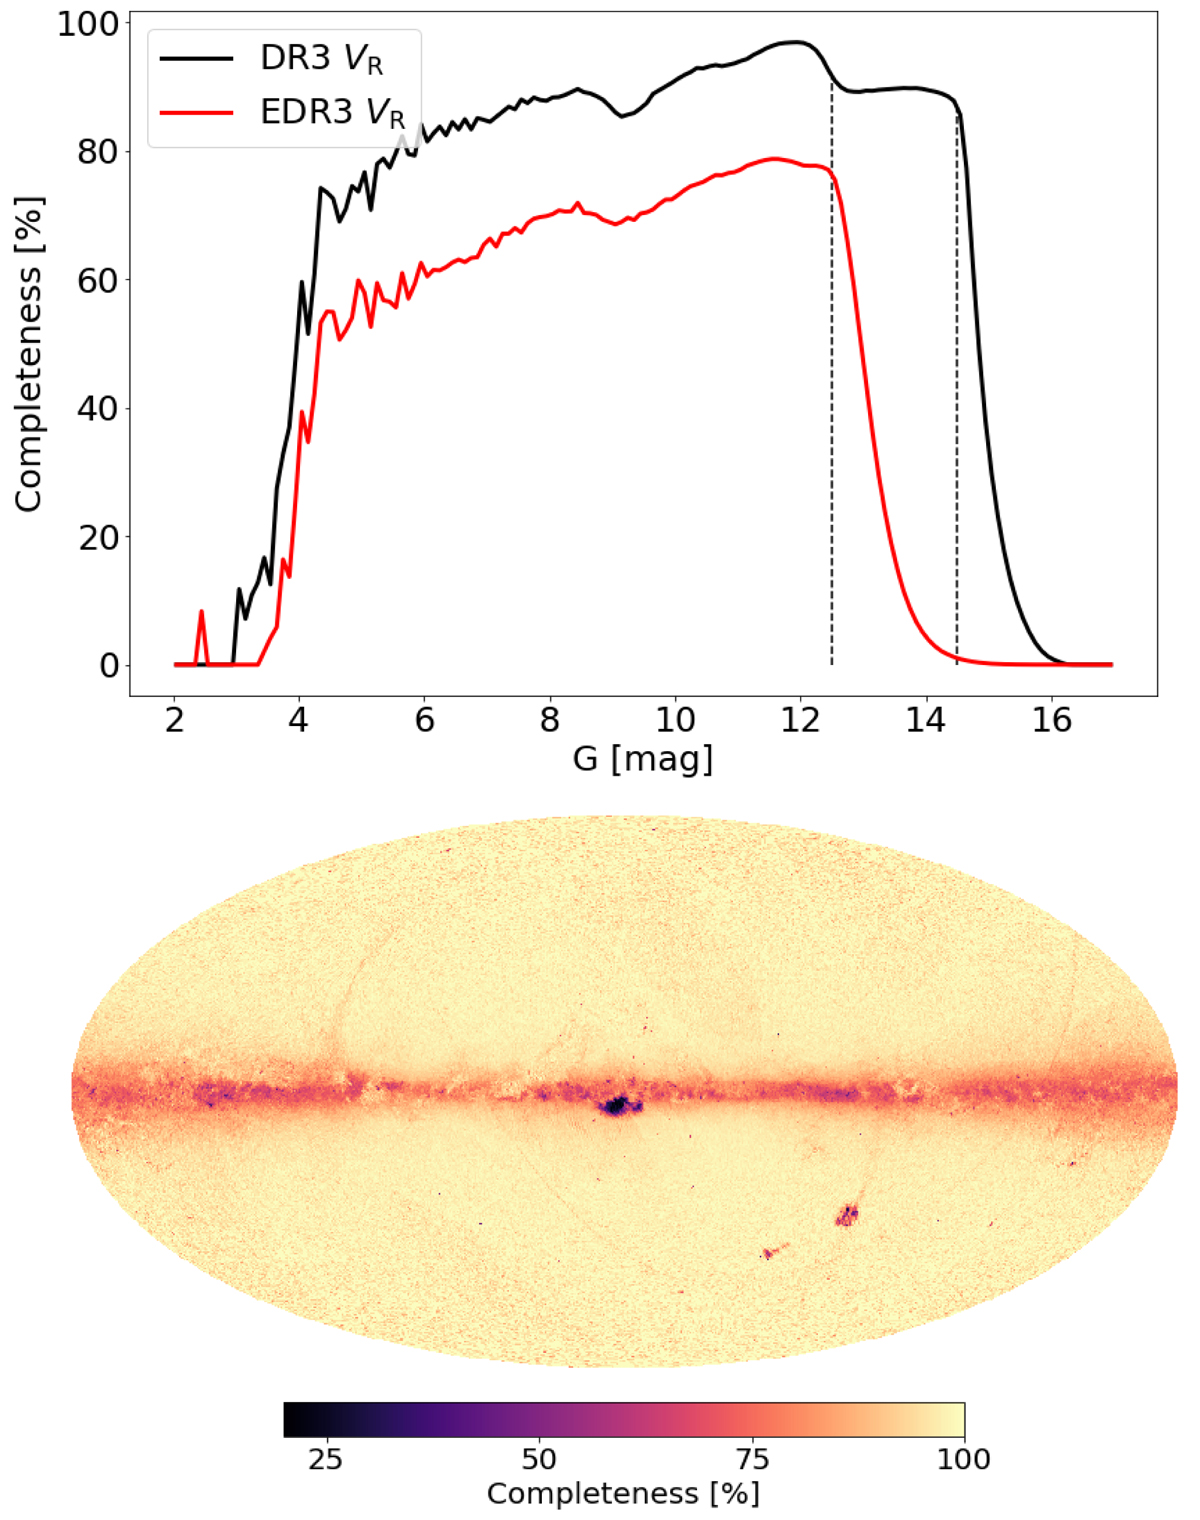
Top: completeness of the Gaia DR3 (black curve) and Gaia EDR3 (red curve) combined radial velocity catalogues as a function of G magnitude. Two dashed vertical lines are drawn at G = 12.5 and G = 14.5 mag, corresponding to the respective drops in completeness of each of the catalogues. Bottom: sky map of the completeness with respect to the Gaia DR3 catalogue (restricted to stars with G ≤ 14.5 mag). The image uses a Mollweide projection in Galactic coordinates (l, b). The Galactic centre is at the centre of the image, and the Galactic longitudes increase to the left. The sampling of the map is approximately 0.2 square degree (healpix level 7).
Current usage metrics show cumulative count of Article Views (full-text article views including HTML views, PDF and ePub downloads, according to the available data) and Abstracts Views on Vision4Press platform.
Data correspond to usage on the plateform after 2015. The current usage metrics is available 48-96 hours after online publication and is updated daily on week days.
Initial download of the metrics may take a while.


