Fig. 3.

Download original image
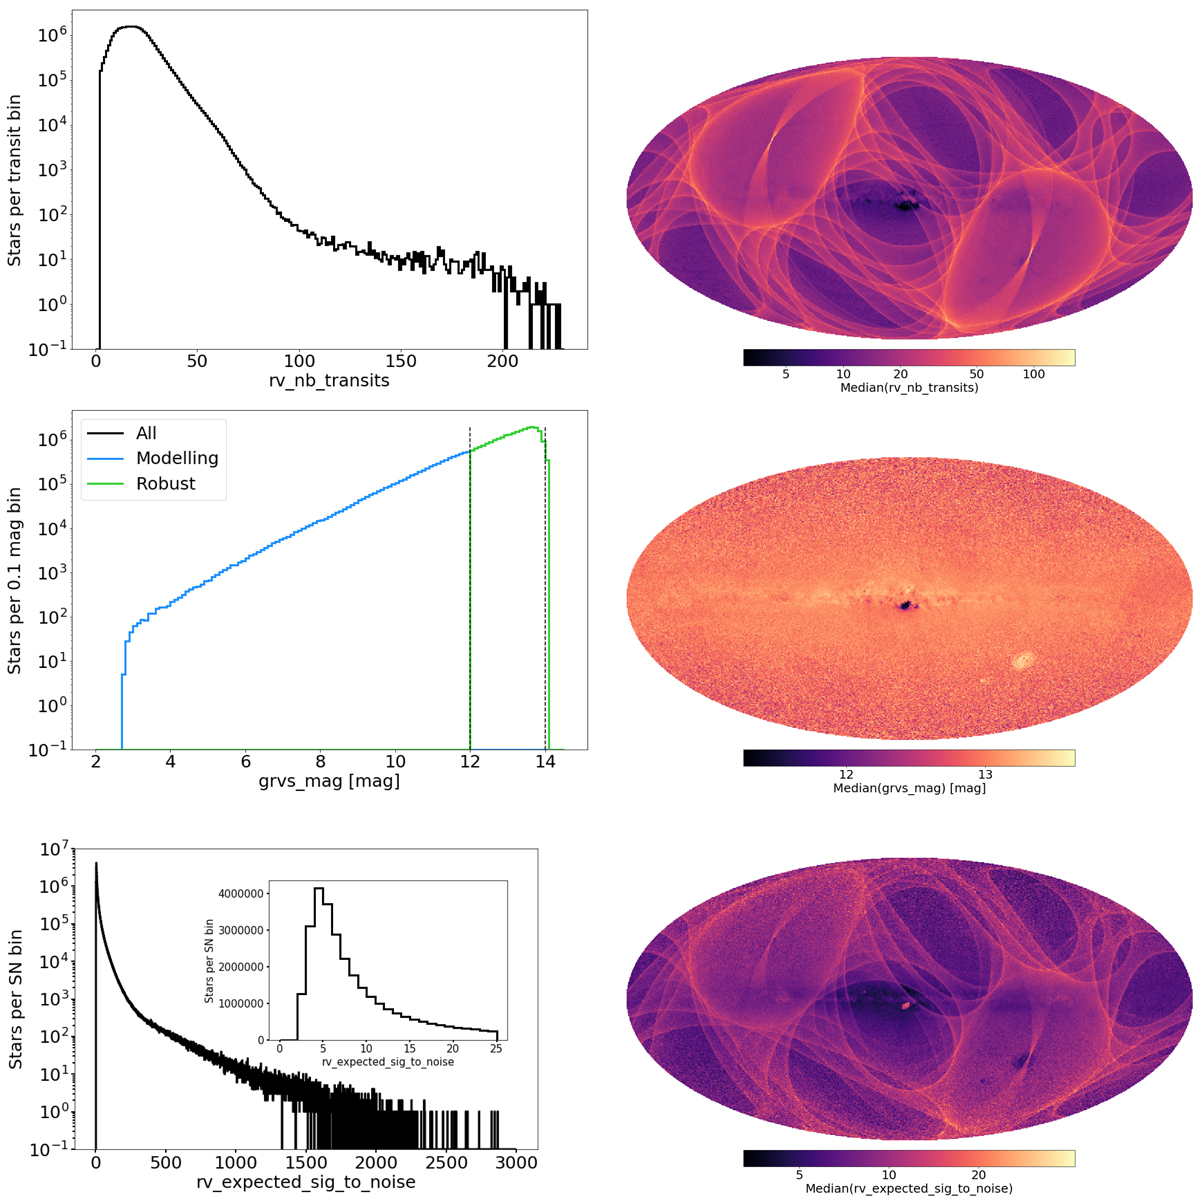
Distributions of the numbers of transits (rv_nb_transits, top), grvs_mag magnitudes (middle), and S/N (rv_expected_sig_to_noise, bottom) of the stars whose combined radial velocity is published in Gaia DR3. In the left column, the distributions are presented in the form of histograms. The right column presents the sky maps of the median values of these three quantities. The maps use Mollweide projections in Galactic coordinates (l, b). The Galactic centre is at the centre of the images, and the Galactic longitudes increase to the left. The sampling of the maps is approximately 0.2 square degree (healpix level 7).
Current usage metrics show cumulative count of Article Views (full-text article views including HTML views, PDF and ePub downloads, according to the available data) and Abstracts Views on Vision4Press platform.
Data correspond to usage on the plateform after 2015. The current usage metrics is available 48-96 hours after online publication and is updated daily on week days.
Initial download of the metrics may take a while.


