Fig. 16.

Download original image
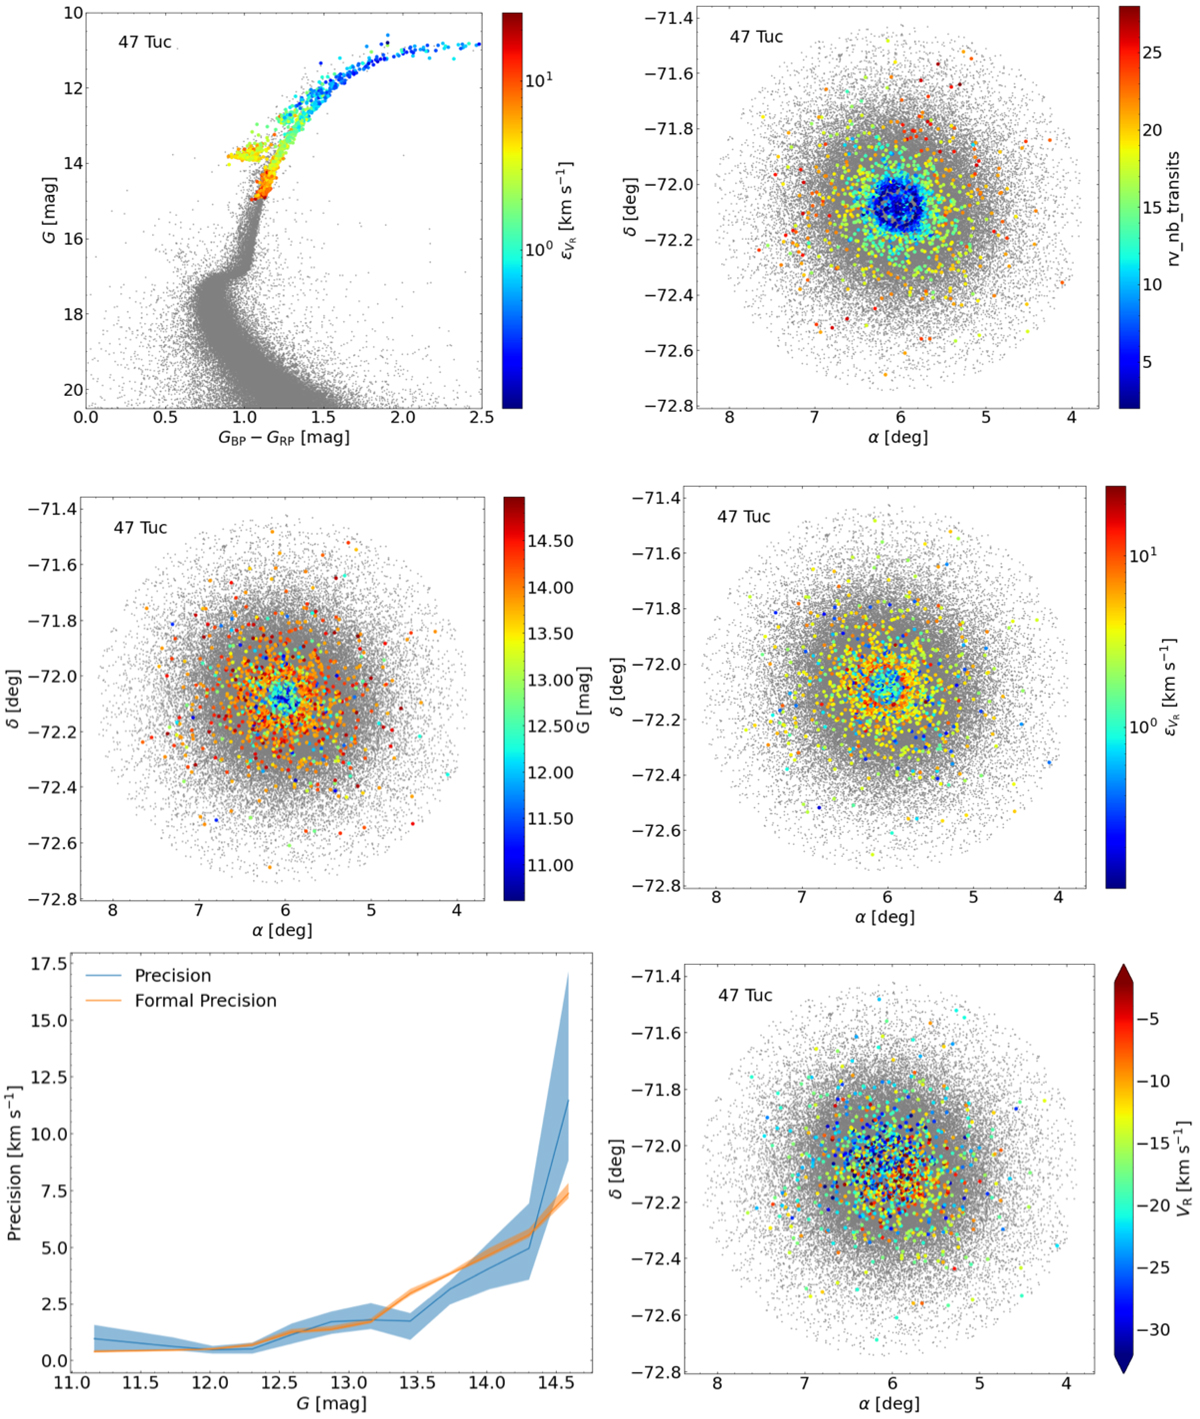
Top left: colour-magnitude diagram of 47 Tuc. The stars with Gaia EDR3 photometry are represented as grey dots. The stars with a Gaia DR3 radial velocity are colour-coded by the formal uncertainties in radial velocity. Top right: distribution in equatorial coordinates (α, δ) of the 47 Tuc stars. Stars with a Gaia DR3 radial velocity are colour-coded by number of transits. Middle left: same as in the top right panel, with the stars colour-coded by G magnitude. Middle right: same as in the top right panel, with the stars colour-coded by the formal uncertainty in radial velocity. Bottom left: comparison of the formal and external precisions (see text) as a function of G magnitude for a sub-sample of 47 Tuc stars. The 68.3% confidence interval on the estimates of the precisions are represented as shaded areas. Bottom right: same as in the top right panel, with the stars colour-coded by combined radial velocity.
Current usage metrics show cumulative count of Article Views (full-text article views including HTML views, PDF and ePub downloads, according to the available data) and Abstracts Views on Vision4Press platform.
Data correspond to usage on the plateform after 2015. The current usage metrics is available 48-96 hours after online publication and is updated daily on week days.
Initial download of the metrics may take a while.


