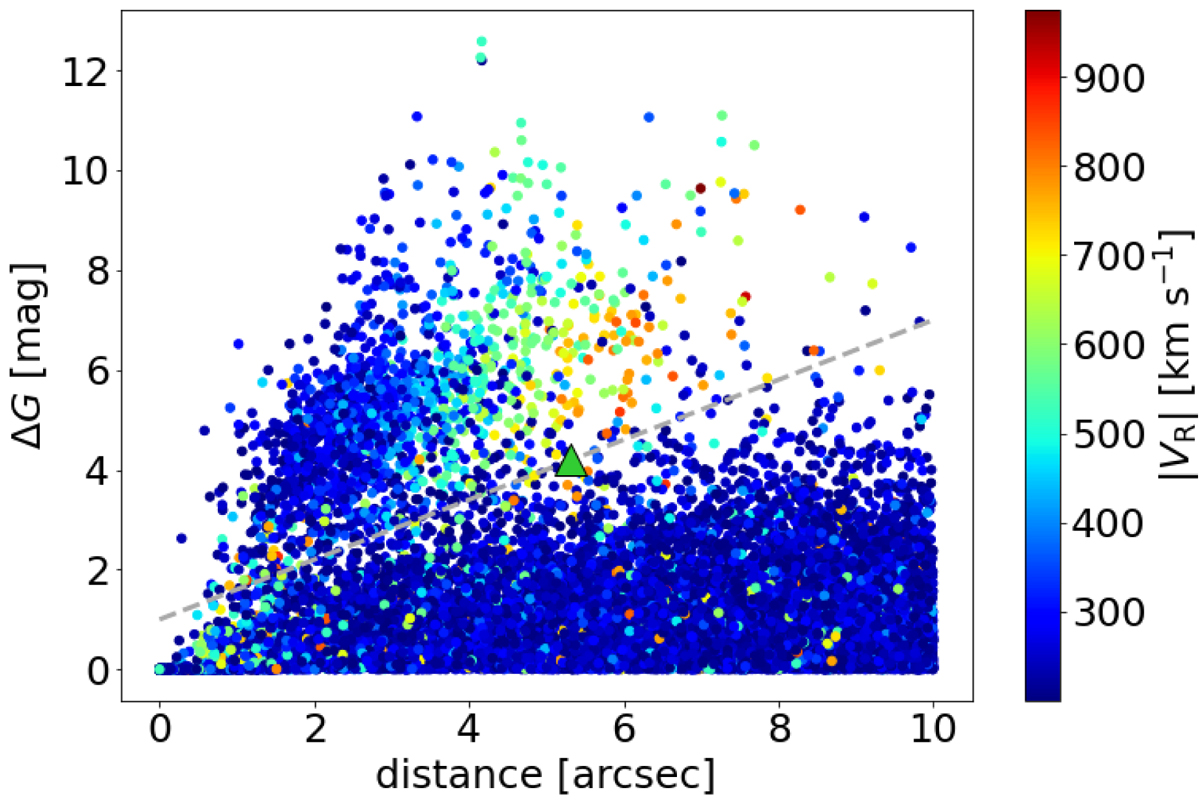
Fig. 1.

Download original image
Differences in G-band magnitude between the stars and their neighbours as a function of their separations on the sky for the 17 697 sources with |VR|> 200 km s−1 and one or more neighbours with a brighter G-band magnitude within a radius of 10 arcsec. The colour code provides the absolute value of the Gaia DR3 combined radial velocities for the star. The dashed grey line shows the separation between the spurious and valid velocity measurements. The green triangle shows the location of star Gaia DR3 4657994321463473792, which was kept in the release even though it is located slightly above the dividing line (see text).
Current usage metrics show cumulative count of Article Views (full-text article views including HTML views, PDF and ePub downloads, according to the available data) and Abstracts Views on Vision4Press platform.
Data correspond to usage on the plateform after 2015. The current usage metrics is available 48-96 hours after online publication and is updated daily on week days.
Initial download of the metrics may take a while.


