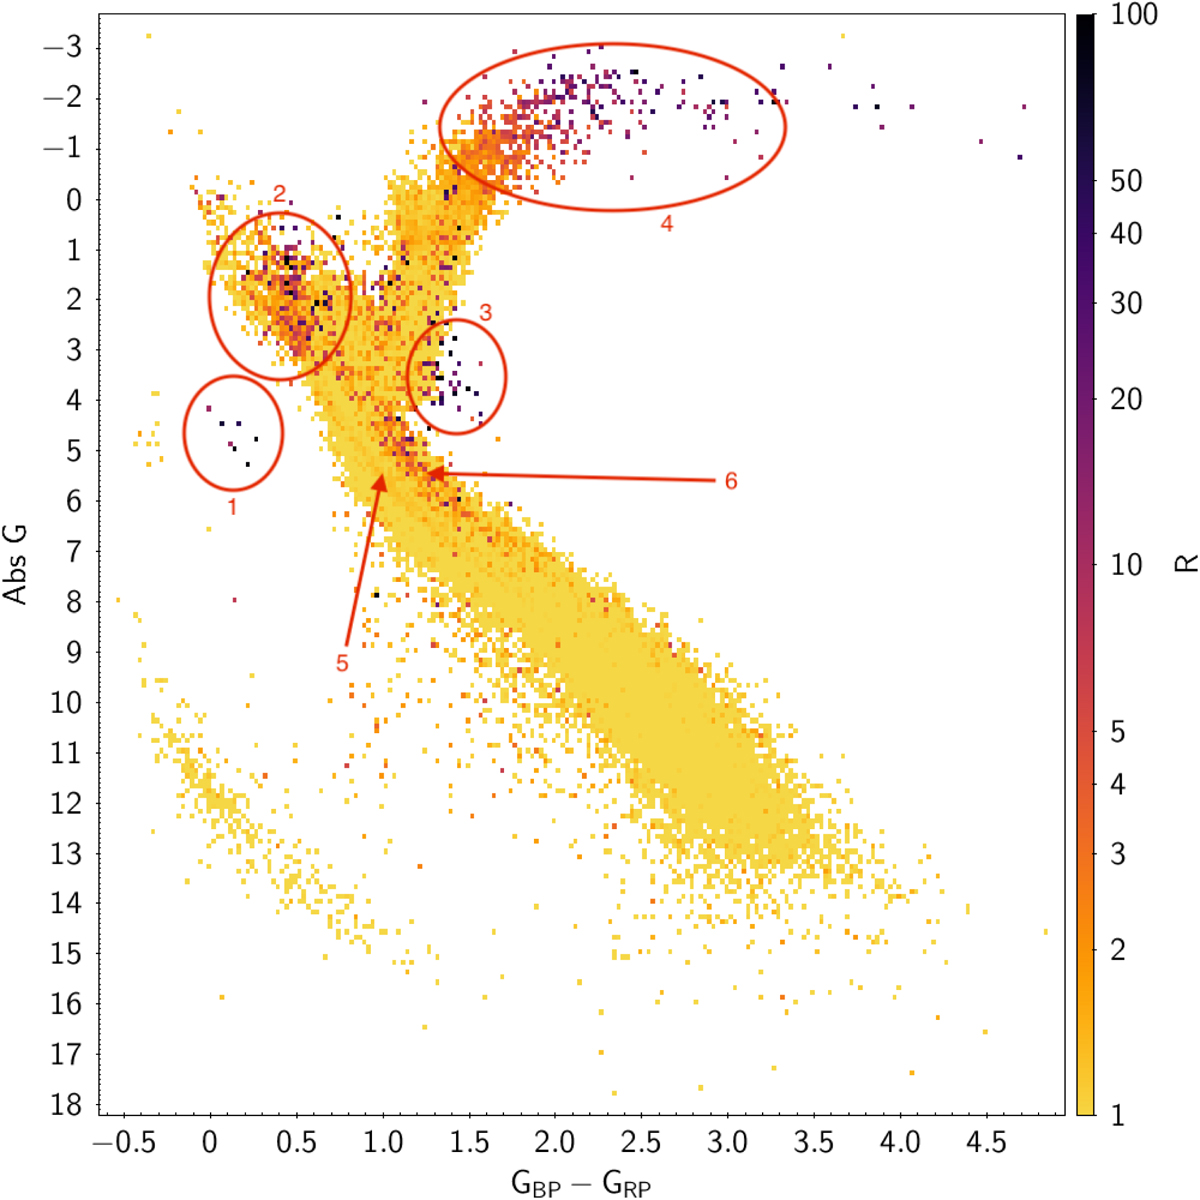
Fig. 19.
Download original image
Colour–absolute magnitude with an auxiliary axis in R from Sect. 6.1. Only stars with a parallax error of better than 10% are used here. Rather than plotting each data point individually, the mean inside an area is shown. This is to avoid the overplotting of data points in the densest regions. The numbered regions are discussed in the text.
Current usage metrics show cumulative count of Article Views (full-text article views including HTML views, PDF and ePub downloads, according to the available data) and Abstracts Views on Vision4Press platform.
Data correspond to usage on the plateform after 2015. The current usage metrics is available 48-96 hours after online publication and is updated daily on week days.
Initial download of the metrics may take a while.